
Does the Covid-19 pandemic-induced change in consumption patterns affect inflation?


The fact that consumer prices in Latvia remained almost unchanged last year (or increased by a mere 0.1%) might be confusing to attentive consumers. In everyday life, we have observed price increases more often than their decreases [1]. Could the very low headline inflation be a result of the rising buckwheat prices offsetting the price decline in international flights (despite the fact that demand for the former has grown significantly, while most flights have been cancelled )? And does it mean that the inflation rate is actually much higher than the official HICP [2] inflation rate?
This article analyses the extent to which a change in the consumption structure caused by the Covid-19 pandemic has affected both the actual inflation and the accuracy of Latvijas Banka inflation projections.
Our estimates suggest that the inflation of the items actually purchased by consumers last year was slightly (0.1 percentage point) higher than the official HICP inflation – the difference between the two is close to the estimated for the euro area.
The difference in Latvia was mainly due to the fact that the weights of international flights and package holidays in the consumption basket were significantly reduced. The impressive fall in these services prices affected the inflation of the items actually purchased by consumers less than the official HICP inflation.
In February this year, the Central Statistical Bureau (CSB) performed the regular annual update of the HICP weights. This time, the weights were changed dramatically, reflecting the structural changes in the consumption basket during the Covid-19 pandemic. The weight changes alone raised annual inflation by 0.2 percentage point in January 2021. It also affected Latvijas Banka inflation projection errors in January 2021. Nonetheless, the impact of weight changes on average inflation is not expected to be significant in 2021. In March, Latvijas Banka raised its inflation projections for 2021 by 0.70 percentage point from 1.1% to 1.8%, but only 0.01 percentage point is attributed to the impact of HICP weight changes.
Impact of the pandemic on the consumption structure
The HICP inflation rate is obtained using the price dynamics of products and their respective shares in the consumption basket. The weights of consumer prices are updated once a year, based on the household consumption structure during the previous year. The consumption structure tends to change very slowly, so annual changes in consumer price weights usually have only a negligible impact on inflation. However, the Covid-19 pandemic has had a significant impact on consumer shopping habits and, therefore, the basket of goods and services people buy on a daily basis has changed. In fact, changes in the 2020 consumption basket were reflected in the 2021 consumer price weights. Yet, two questions remain: did the inflation of the items actually purchased by consumers last year differ from the official HICP inflation, and to what extent was the rise in inflation at the beginning of 2021 affected by the changes in consumer price weights?
Processed food products recorded the largest increases in their HICP weights, while services saw the most significant declines (Figure 1).
Figure 1. Ten product groups with the largest changes in consumer price weights in 2021 (percentage points)
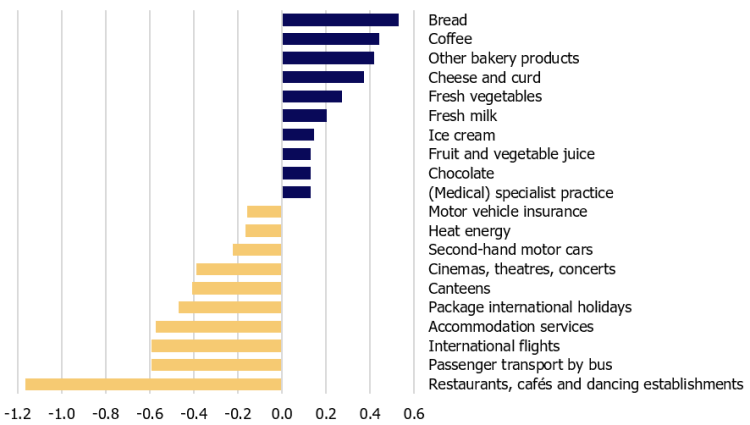
The consumption basket weights have also increased for all unprocessed food products, particularly fresh fruit and vegetables. Given the pandemic restrictions, people cooked at home more often as well as paid more attention to a healthy diet.
Processed food products, in particular, bread, cereals, confectionery, dairy products, fruit and vegetable juices, as well as coffee and chocolate, gained the largest weight increases in the consumption basket.
The growing popularity of these products could be explained by both more frequent cooking at home and the stocking of food with long expiry dates. Spirits have also enjoyed higher demand, in part due to their disinfectant properties. Meanwhile, tobacco products were less popular due to reports of smokers having worse outcomes after contracting the virus.
The weight of energy products in the consumption basket has decreased only slightly. Despite low crude oil prices, which drove prices of heat energy and natural gas downwards, people used cars more often avoiding public transport, hence the weight of petrol increased somewhat.
The share of non-energy industrial goods in the consumption basket remained unchanged.
On the one hand, people's willingness to make big purchases has decreased on the grounds of elevated uncertainty about the future – consumers postponed the purchases of cars and furniture. On the other hand, car drivers used their own vehicles more intensively raising demand for tires and other car spare parts. Expenditure on bicycles also increased. The widespread teleworking encouraged people to focus on home improvements, stimulating demand for household appliances as well as housing maintenance and repair materials. Given that the possibilities for outdoor social entertainment were almost non-existent, the weight of books and magazines in the consumption basket grew. Concerns about possible future supply disruptions also led people to increase their medicine stocks.
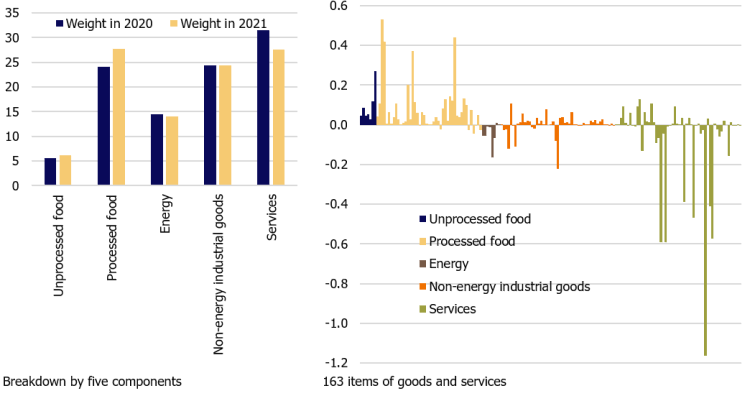
The share of services in the consumption basket decreased significantly following the government restrictions imposed on catering, accommodation and passenger transport services, as well as on culture and tourism services. On the contrary, the share of expenditure on medical services (excluding dentistry) and that on maintenance and repair of personal transport equipment increased (Figure 2).
Figure 2. Consumer price weight changes in 2021 (differences in weights used in inflation calculation in 2021 as compared to those used in 2020; percentage points)
The impact of consumption basket changes on inflation
The rapid changes in the consumption basket reveal two aspects. First, the inflation of the items actually purchased by consumers in 2020 may have differed from the official HICP inflation; second, the rise in HICP inflation at the beginning of 2021 may partly reflect the impact of the changes in consumer price weights.
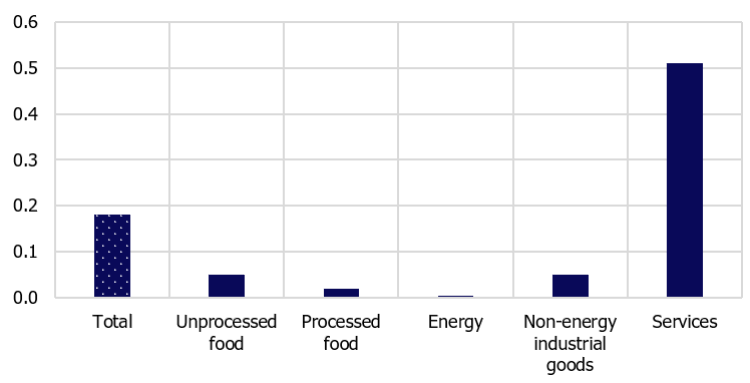
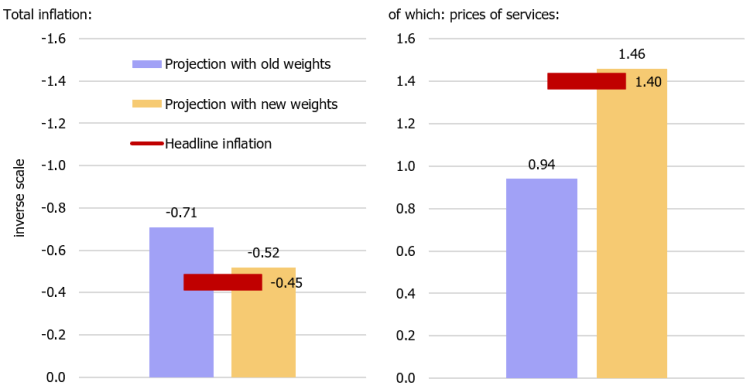
Our estimates show that the inflation of the items actually purchased by consumers in 2020 (inflation of 2020 with consumer price weights of 2021) was only 0.1 percentage point higher than HICP inflation (0.2% and 0.1%, respectively). In turn, the change in HICP weights increased Latvia's inflation in January 2021 by 0.2 percentage point (inflation in January was –0.5% in annual terms; it would have been –0.7% without the changes in HICP weights). This is due to an increase in the weight of goods and services whose prices have risen over the last year (e.g. bread); and a decrease in those components whose prices have fallen. In January, the largest impact on inflation came from the changes in the weights of international flights and package holidays abroad – the weights of these products have fallen along with significant decreases in their prices (Figure 3). As long as both products are included in the services product group, we can observe that in January the impact of the changes in the consumption structure on inflation was particularly large in services (Figure 4).
Looking ahead, our estimates suggest that, on average, the impact of the changes in consumption patterns on 2021 inflation is likely to be small as the positive impact on inflation in January will be largely offset in the coming months [3].
In March, Latvijas Banka inflation forecast for 2021 was raised by 0.70 percentage point (from 1.1% to 1.8%), but only 0.01 percentage point was driven by the impact of consumer price weight changes.
The Covid-19 containment measures are likely to be lifted in the second half of this year. As a result, some services will be more accessible to consumers and, for example, the prices for accommodation services will rise; but, with a lower weight in consumer prices, this will increase HICP inflation only slightly. Thereby, the inflation of the items actually purchased by consumers might somewhat exceed the HICP inflation this year.
Figure 3. Impact of changes in consumer price weights on headline HICP inflation in January 2021 by component
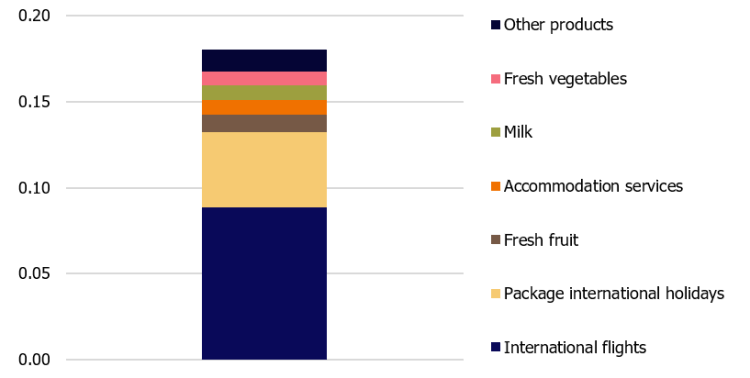
Figure 4. Impact of changes in consumer price weights on HICP inflation in January 2021 (percentage points)
Source: CSB data, authors' calculations
Impact of the consumption structure on the accuracy of Latvijas Banka inflation projections
In order to assess the impact of the consumption structure changes on the accuracy of Latvijas Banka inflation projections, we compare our inflation forecast made in November 2020 [4] over January 2021 with the actual inflation in January 2021, as well as the inflation that would have been observed in January 2021, had the consumer price weights remained unchanged.
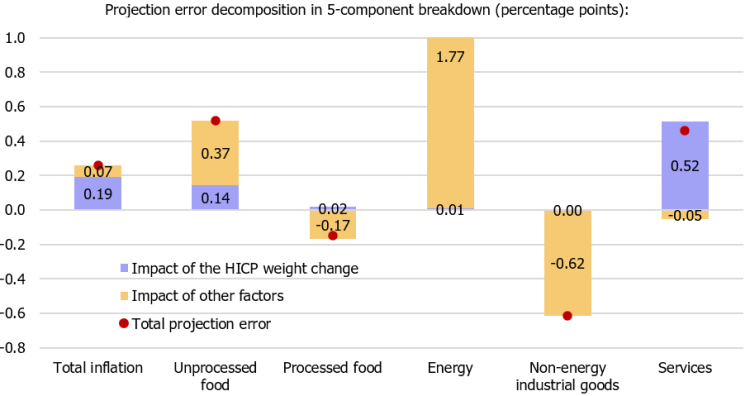
Our analysis shows that the projection errors in January 2021 were mostly caused by the changes in consumer price weights. The impact of the weight changes on inflation accounts for about two-thirds of the overall projection error.
The decomposition of the projection errors by component provides some additional insights. First, the rise in services prices in January was significantly higher than expected (1.40% and 0.94%, respectively), yet the whole projection error is explained by the changes in consumer price weights. Had the consumer price weights remained unchanged (or had the consumer price weights been known exactly at the end of last year), the rise in service prices in January would have been nearly perfectly projected (Figure 5).
Second, the significant projection error in the components of energy and industrial goods is not related to the changes in consumer price weights. The underprojection of energy prices (i.e. positive errors) stems from a significant rise in oil prices. In turn, non-energy industrial goods prices were lower than expected, which likely reflects the efforts of retailers to raise sales (by lowering prices) in anticipation of tight retail trade restrictions.
Figure 5. Inflation projections error decomposition in January 2021 (percentage points)
Is Latvijas Banka inflation projections' model appropriate in these turbulent times?
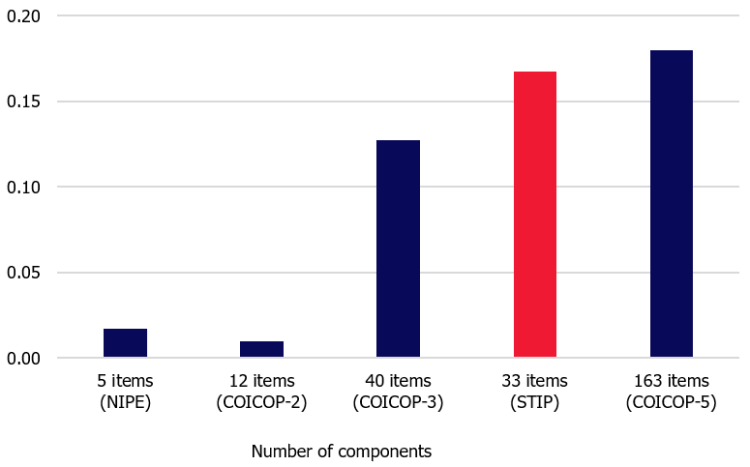
It turns out that the level of disaggregation of consumer prices plays a crucial role in assessing the impact of weight changes on inflation and its projection errors. In order to accurately forecast 2021 inflation at the end of 2020, it was not enough to have information on the weights at a higher level of disaggregation such as the weights for processed food or services. The change in consumer price weights disaggregated into five components explains only one tenth of the total weight change effect. Ideally, one should forecast HICP inflation at the very detailed COICOP5 level, which is nearly impossible. Latvijas Banka inflation projections' model (STIP) uses a breakdown of consumer prices into 33 components, and this breakdown turns out to be successful in capturing almost the entire effect of the weight changes. The STIP model distinguishes those consumer price components which were severely affected by the pandemic (international flights, accommodation services, package international holidays) and incorporates the changes in the consumer basket significantly better compared to the 40 components in the COICOP-3 classification (Figure 6). Hence, the level of disaggregation chosen in the STIP model proves to be appropriate for making inflation projections even in a pandemic environment.
Figure 6. Impact of changes in consumer price weights on inflation in January 2021 depending on the level of disaggregation of the consumer price index (percentage points)
Takeaways
- Due to significant changes in the consumption basket during the pandemic, inflation of the items actually purchased by consumers in 2020 was 0.1 percentage point higher than HICP inflation (0.2% and 0.1% respectively).
- The change in the weights of consumer prices increased inflation by 0.2 percentage point in January 2021 (i.e., the year-on-year inflation rate was –0.5% in January 2021; without changes in the weights of consumer prices it would have been –0.7%).
- With the Covid-19-related restrictions lifted, people will be likely to return to their pre-pandemic shopping habits. As a result, both the prices of international flights and those of package holidays will increase along with their respective shares in the consumption basket. Yet, the weight of these services is currently low, and inflation of the items actually purchased by consumers is again likely to increase slightly more than HICP inflation.
References
[1] For example, looking at the list of average retail prices of selected goods and services published by the Central Statistical Bureau of Latvia, in 56 cases the price level increased during 2020 and in only 40 cases it decreased (when comparing the price level in December 2020 to that in December 2019).
[2] Harmonized index of consumer prices. It is the main inflation variable used by Latvijas Banka and European Central Bank in the analysis and projections of consumer prices. More details on HICP structure may be found in Latvijas Banka working paper No. 1/2020.
[3] Precise impact will be known in 2022 – after the release of the inflation data for December 2021.
[4] In November, inflation projections were sent to the European Central Bank under the framework of NIPE projection rounds, while in December it was published on Latvijas Banka website. For more details about the inflation projections' model developed by Latvijas Banka and about the projection rounds in the European System of Central Banks, see Latvijas Banka working paper Nr. 1/2020.
Textual error
«… …»