
How can Latvia catch up with Estonia and Lithuania?


There has been a significant income gap between Latvia and its northern neighbour Estonia for a long time, and it continues to widen in absolute terms. Moreover, during the past decade Latvia has also been lagging behind its southern neighbour Lithuania. Why is it the case and what needs to be done in Latvia to achieve a standard of living comparable to that of our neighbours in the foreseeable future?
A few years behind the neighbours
Latvia's average income level is one third lower than the European Union (EU) average. In terms of time, we lag behind by about 15 years – Latvians are now as prosperous as the average citizen of EU-27 in around 2005. Estonia and Lithuania are lagging behind the EU-27 average income level half as much as Latvia. Although the Covid-19 crisis has reduced the income level in all EU countries, it is not expected to significantly change Latvia's relative income position [1].
In terms of income, Latvia has been lagging behind Estonia for a long time. Back in the early 2000s, our northern neighbour was about 10 percentage points ahead of us, whereas now – 15 percentage points. Meanwhile, Lithuania's breakthrough is a phenomenon of the last ten years: before the global financial crisis, income levels in both countries were quite similar (Figure 1).
Figure 1. GDP per capita in the Baltic countries (purchasing power parity adjusted)
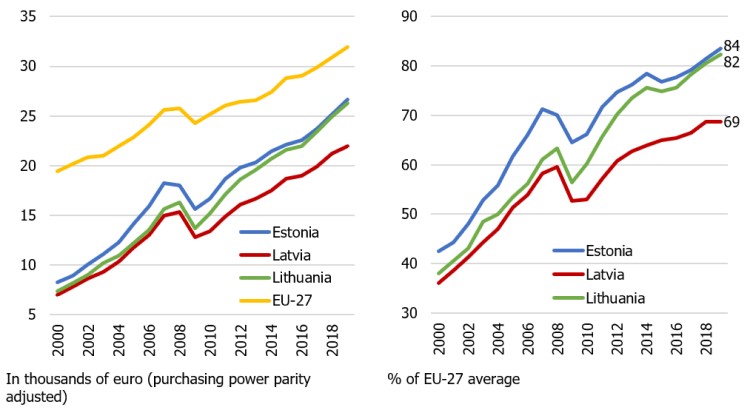
It should be noted that a widening income gap between Latvia and its EU neighbours is, to some degree, an optical illusion. When two economies grow at the same speed, over time their income gap expands in absolute terms, while remaining unchanged in relative terms. At present, the average income level in Estonia is about 20% higher than in Latvia – a similar difference was recorded 15 years ago.
Why are we lagging behind?
This article is not about the "thousand and one differences" between the Baltic countries, starting with the share of Catholic population and ending with the degree to which the Baltic societies can be described as "indulgent" or "individualistic" [2]. Stories like "Estonia is doing better because of shale mining" or "Lithuania is ahead of us because manufacturing accounts for a larger share in its economy", in my view, are ambiguous and, therefore, should be left to the lobbies of the respective industries [3]. Simply listing all the possible differences between the Baltic countries would be an easy task; instead, we go the hard way by trying to explain why a particular factor impacts the path of economic development.
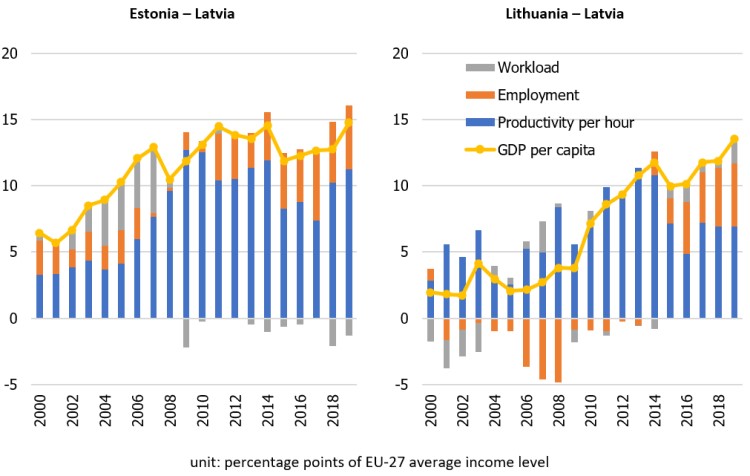
GDP per capita or income level (i.e. product of hourly labour productivity, employment rate and workload) of Latvia is consistently lagging behind that of Estonia and Lithuania. The labour productivity component accounts for most of the income differences between the Baltic countries. More specifically, productivity represents 11 out of 15 percentage points of the difference with Estonia and 7 out of 13 percentage points – with Lithuania. The role of productivity in cross-country income disparities is natural, confirming what Paul Krugman said, "productivity is not everything, but in the long run it is almost everything." [4]
However, in the case of the Baltic countries, the employment component also has a significant impact on income differential. It is the employment component that has largely contributed to the growing income gap between Lithuania and Latvia over the last ten years (Figure 2).
Figure 2. Breakdown of cross-country differences in GDP per capita
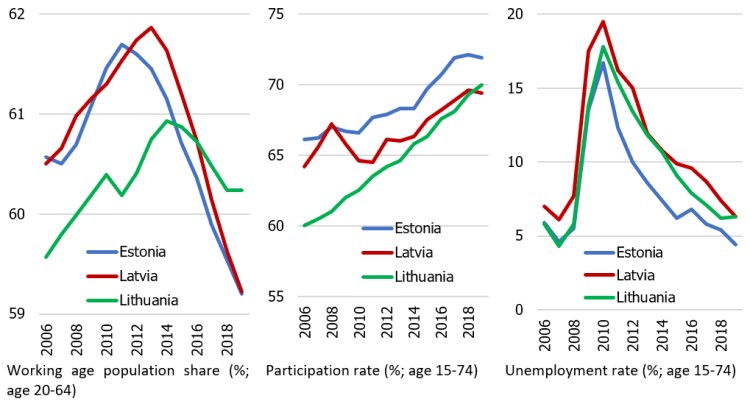
The employment component reflects labour market and demographic factors. It consists of three elements: the share of the working age population, participation rate (the share of the working age population that is working or is actively looking for a job) and the unemployment rate (the share of the economically active population that is actually unemployed).
With respect to all three elements, Lithuania has recently made more progress than the other Baltic countries. For example, due to different dynamics of the population age structure, the share of the working age population in Lithuania peaked a few years later than in Latvia and Estonia; therefore, the share of the working age population is currently higher in Lithuania. The increase in the participation rate in Lithuania, which can be partly attributed to its low initial level, has also been quite impressive (Figure 3).
Figure 3. Working age population, participation rate and unemployment rate in the Baltic countries
In a similar manner, the relative income difference is determined by the components of productivity and employment. In recent years, productivity growth in Latvia has been slightly faster than in Lithuania and Estonia, partly because Latvia's initial productivity level was low, thus making it easier for it to increase (beta-convergence effect). With the productivity level increasing, structural reforms need to be pursued in order to maintain growth rates at least at the current levels.
Lithuanian economic growth – partly a statistical paradox?
It cannot be ruled out that the official statistics have overestimated the relatively fast income growth in Lithuania during the recent years, and thus the GDP per capita gap between Lithuania and Latvia might also have been overestimated.
There is a strong positive relationship between income and price levels. It is evident both in the same country in different time periods (e.g. since the early 1990s, the purchasing power of one US dollar in Latvia has significantly decreased due to rising income), and internationally (e.g. in Switzerland one can buy much less goods and services for one US dollar than in India).
The price level in Lithuania has historically been lower than in Latvia, whereas the income level has been higher (Figure A1). On the one hand, there is a reason for this – everyone who has been to Lithuania will agree that the prices in department stores are lower (in the coming months, Latvians will be able to judge to what extent this is the effect of the retail giant Lidl). Car fuel prices in Lithuania are also lower, partly due to smaller excise tax rates. Moreover, since the turn of the century prices for administrative and utility services (electricity, natural gas, heat energy, postal services) have been growing at a much slower pace in Lithuania than in Latvia and Estonia (Figure A2).
On the other hand, one may suggest that the price level in Lithuania is underestimated, and thus real income (i.e. GDP per capita in the prices of the base year) – overestimated. In particular, Swedbank economists have pointed out that private consumption of Lithuania significantly exceeds that of Estonia and Latvia, and there seems to be no objective reason for it. The difference in private consumption could be due to a significant statistical adjustment, which can artificially increase the estimate of Lithuania's real GDP (and thus its income level).
From bronze to gold medal in one generation
Latvijas Banka's discussion paper shows that Latvia's domestic labour reserves are far from exhausted. Thus, a higher employment rate would facilitate a significant rise in the level of income. This is even more relevant in the context of the Covid-19 crisis during which several thousand people have lost their jobs.
Success in activating labour reserves is based on four whales. The first is education – higher quality, access to lifelong learning, opportunities to improve digital skills. The second whale is health – better healthcare and healthier lifestyle. The third whale is tax policy – reduced tax wedge on labour income. Finally, the fourth whale is employment policy with a special focus on population groups and municipalities with particularly low employment.
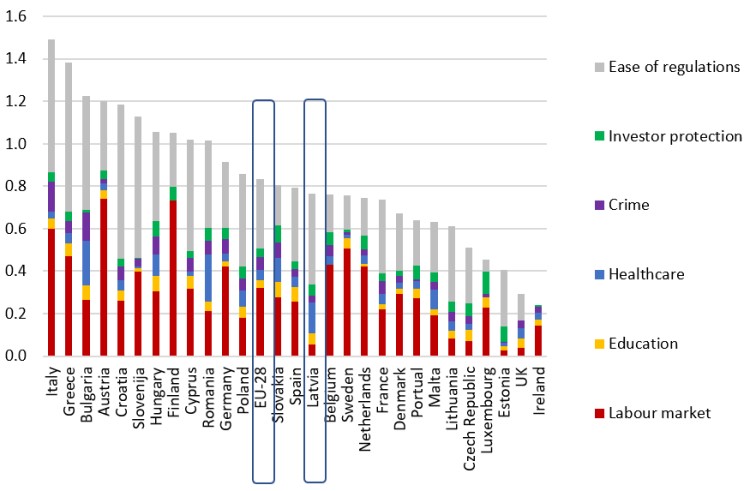
There is no better recipe for productivity than structural reforms. A 2018 study by the European Central Bank and Latvijas Banka shows that by introducing the best institutional practices to all EU countries, GDP per capita growth can accelerate to almost one percentage point per year (Figure 4).
Figure 4. The increase in GDP per capita that could be achieved by introducing best EU institutional practices in the EU countries (percentage points per year)
At the beginning of the century, the institutional quality of Latvia and Lithuania alike lagged behind that of Estonia. Since then, Lithuania has implemented decisive structural reforms; therefore, in terms of institutional quality, it has fared better than Latvia in catching up with Estonia (Figure 5). The introduction of EU best institutional practices would allow Latvia to accelerate income growth by about 0.8 percentage points per year – in the medium term, this is a significant growth dividend.
Figure 5. Structural reform progress in the EU countries (impact on the annual economic growth rate; percentage points)
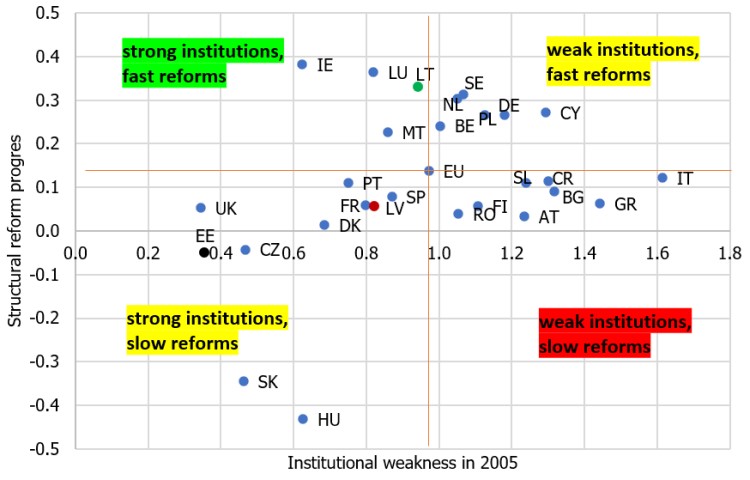
Source: figures are based on the following research results: Krasnopjorovs, O. "Which structural reforms matter for long-term growth in the EU?" in Masuch, K., Anderton, R., Setzer, R. and Benalal, N. (editors) "Structural policies in the euro area", Occasional Paper Series, No 210, ECB, June 2018, pages 76–77.
Implementing structural reforms, in particular, reducing bureaucratic constraints, strengthening investor protection, as well as raising the quality of education and healthcare, would allow Latvia to raise its relative income level in the Baltic countries from the third to the first place – and this within one generation.
[1] Data for the whole year 2020 are not yet available, and it would be premature to judge which EU countries overcame the Covid-19 crisis with smaller losses (also in terms of income).
[2] The origins of the idea that the Nordic countries may have higher income level than those on the equator can be traced back to the 18th-century book "The Spirit of the Laws" by the French philosopher Montesquieu. In turn, the German philosopher and sociologist Max Weber wrote in the early 20th century that it was the Lutheran faith that promoted wealth accumulation and thus economic development. One of today's classical studies on the uncertainty of growth models concludes that countries with a Confucian faith are developing faster (other factors held constant). In total, the academic literature identifies several hundred factors that could potentially impact the economic growth rate.
[3] Technically, a larger share of manufacturing could only increase the income level if productivity in manufacturing is higher than in the economy as a whole. This pattern is not observed in Latvia.
[4] "Productivity isn't everything, but in the long-run, it is almost everything" (Paul Krugman. "The Age of Diminished Expectations", 1994).
-
Figure A1. Income and price level in the EU countries (% of the EU average; 2019)
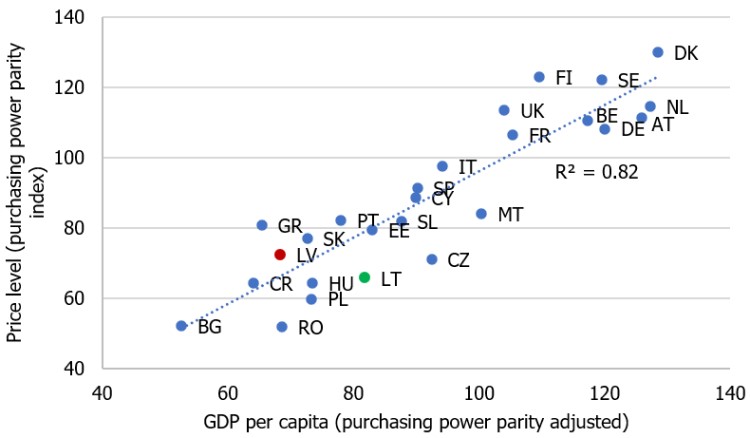
Source: Eurostat data, author's calculations.
-
Figure A2. Selected administrative and utility price indices in the Baltic countries (year 2000 = 100)
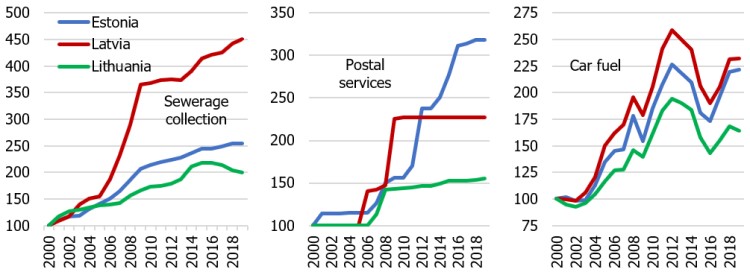
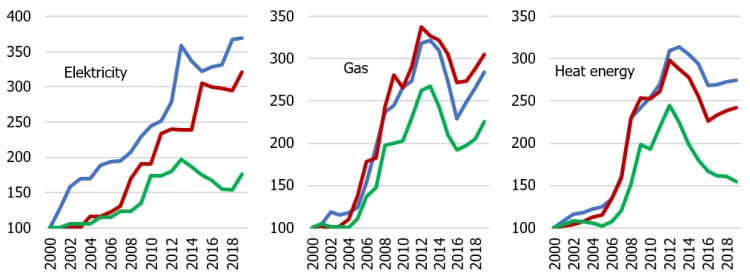
Source: Eurostat data, author's calculations.
Textual error
«… …»