
Latvian labour market in the shadow of Covid-19 crisis: seven facts


Although the Covid-19 crisis is not over yet, we can already see its impact on the labour market in Latvia in terms of both the magnitude and the extent to which different industries, occupations, municipalities and population groups have been affected.
1. Job losses are much lower than during the 2009 crisis
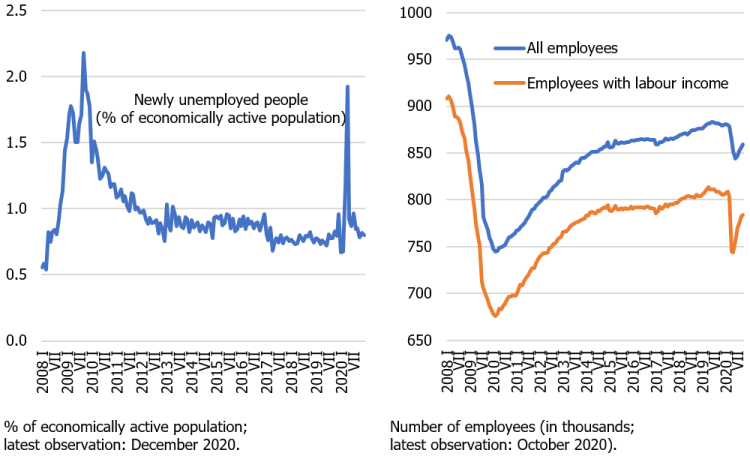
Last spring, the rate at which people lost their jobs and registered as unemployed was quite similar to that experienced during the Global Financial crisis of 2009. However, this time, the increase in layoffs was relatively short-lived, and, currently, the overall reduction in the number of jobs is several times smaller than in 2009.
Covid-19 is the first global crisis that has affected Latvia as a member of the euro area. Owing to the expansionary monetary policy of the European Central Bank, Latvian government can now borrow money at record-low interest rates and provide the necessary stimulus to economic activity. Instead of implementing ‘belt-tightening’ measures, the government is offering a number of support mechanisms, allowing companies to retain employees even if they experience a substantial decline in turnover.
In summer, the number of jobs partially recovered, supported by the easing of some Covid-19 containment measures; and this employment recovery was stronger than would be expected from the seasonality effect alone (Figure 1). At the end of the year, the epidemiological situation deteriorated again. Tightening of the Covid-19 containment measures negatively affected economic activity. This time, however, the number of layoffs (proxied, for instance, by the number of the newly unemployed) was significantly lower than in spring.
Figure 1. The employed and the newly unemployed (seasonally adjusted data)
2. Employment developments differ by sector and occupation
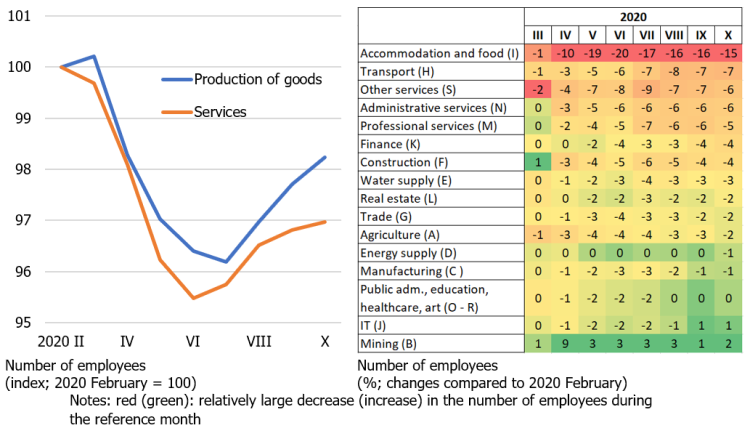
So far, job losses in the services sector have been bigger than those in the goods-producing sectors, as services were more exposed to Covid-19 containment measures. Moreover, different services have been affected quite differently. For instance, in October accommodation and food services had 15% less jobs than in February. At the same time, the number of jobs in information technology (IT), education, healthcare and public administration remained almost unchanged (Figure 2).
Figure 2. Employment changes by sector (seasonally adjusted data)
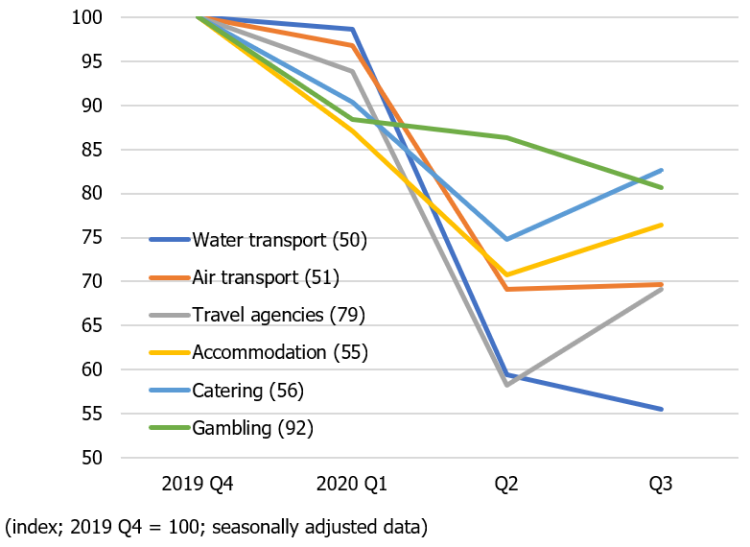
Digging into more detail on the services subsectors, the largest job decreases were posted by water transport, air transport, accommodation, food services as well as gambling and travel agencies. In most of these subsectors, the employment recovery was negligible in the third quarter of 2020, with the number of employees still significantly lower than before the Covid-19 outbreak (Figure 3). Positive changes are unlikely to be expected here before the restrictions on international passenger flows, imposed to contain the virus, are lifted.
Figure 3. Number of jobs in the most-affected services subsectors
By occupational group, service and sales workers as well as clerical support workers (ISCO groups 5 and 4 respectively) suffered the largest job losses. In spring, the number of workers in these occupational groups was 10–20% lower than before the Covid-19 outbreak (5–10% lower in November).
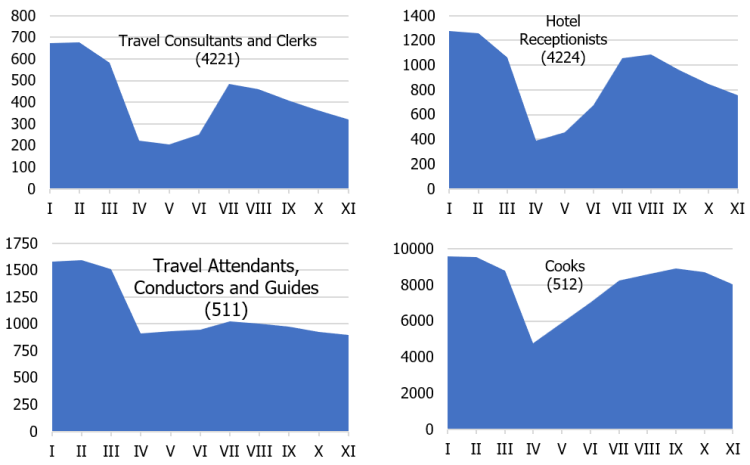
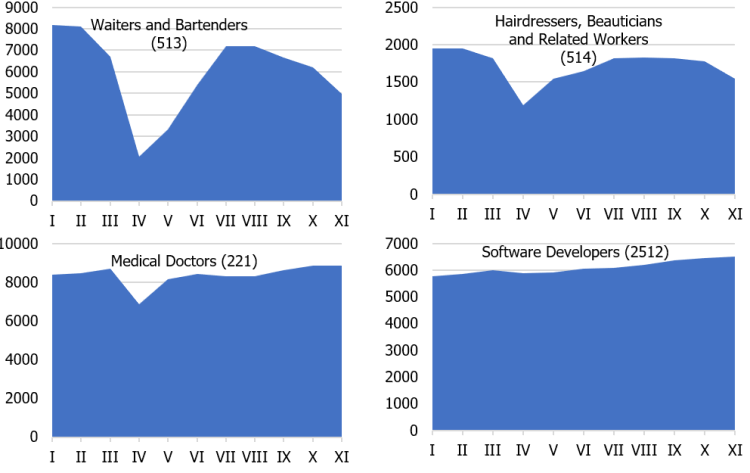
Employment developments differ across occupations as well. For example, the numbers of cooks and hairdressers, during the period between the significant fall in spring and the gradual decline in autumn, almost returned to their pre-crisis levels. In turn, employment in tourism-related occupations (waiters, hotel receptionists, travel agency staff), after falling in spring, recovered only partially, before decreasing again in autumn. The number of travel attendants and guides fell by 40% during the crisis, and it has remained low. On the other hand, the number of workers in some occupations (e.g. medical doctors, software developers; Figure A1) even increased last year.
3. More jobs lost in the private sector
Since March 2020, 90% of all job losses have been in the private sector (Figure 4) as it includes industries most affected by the crisis, e.g., accommodation and food services, beauty care, tourism, etc.
Figure 4. Employment changes in the public and private sectors (seasonally adjusted data)
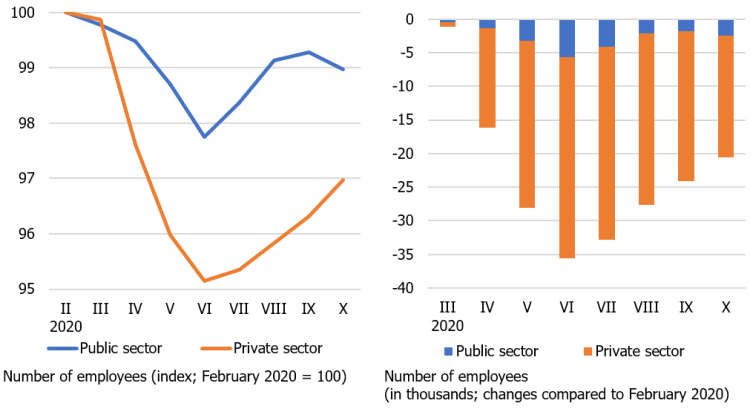
Similarly, private sector posted more layoffs at the beginning of the Financial Crisis in 2009. However, within a few months, layoffs (and wage cuts) also affected the public sector. Given a sharp drop in tax revenues, the government was unable to fund all its functions at the previous level. This further dampened domestic demand, thus deepening the crisis in the private sector.
4. Men and women were similarly affected by layoffs
At the beginning of the Covid-19 crisis, it seemed that women would be more affected by layoffs, as services sectors mostly employ women. So far, however, women's and men's employment has suffered similarly (Figure 5). While women are indeed predominantly employed in accommodation and food services, sectors severely hit by the crisis, many women also work in education and healthcare which have suffered almost no layoffs. In addition, the Covid-19 crisis has had a significant impact on male-dominated sectors as well.
Figure 5. Employment changes by gender (seasonally adjusted data)
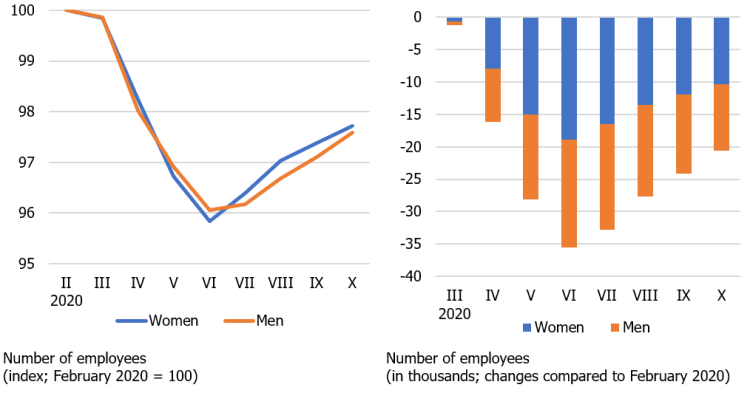
Usually, men working in the private sector are more likely to lose their jobs during an economic slowdown. This was also the case in 2009, when construction and manufacturing (male-dominated sectors) experienced major layoffs, especially at the beginning of the crisis.
5. Young people suffered more layoffs
Generally, crises have a disproportionate impact on youth employment. The Covid-19 pandemic is no exception. The situation has been further exacerbated by the massive layoffs in the accommodation and food services sectors which employ a large number of young people. According to the data obtained so far, people below 30 years of age account for about a half of the employment decrease in Latvia. The employment prospects of those aged between 15 and 19 deteriorated in particular, with their seasonally adjusted employment declining by one third during the summer of 2020 (Figure 6).
Figure 6. Employment changes by age group (seasonally adjusted data)
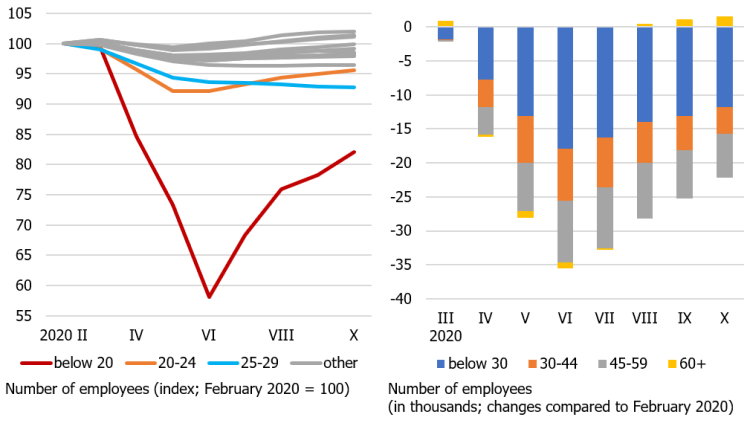
In contrast, the number of employees over the age of 60 has even increased slightly since the Covid-19 outbreak. This partly reflects the sectoral effect (many people in this age group work in education and healthcare sectors which were not experiencing massive layoffs) and the gradual ageing of the population.
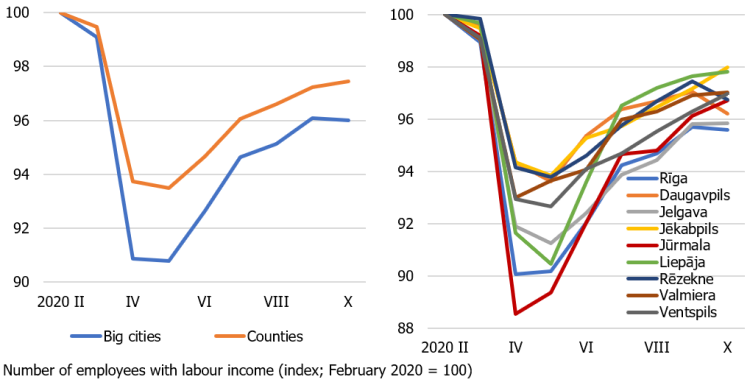
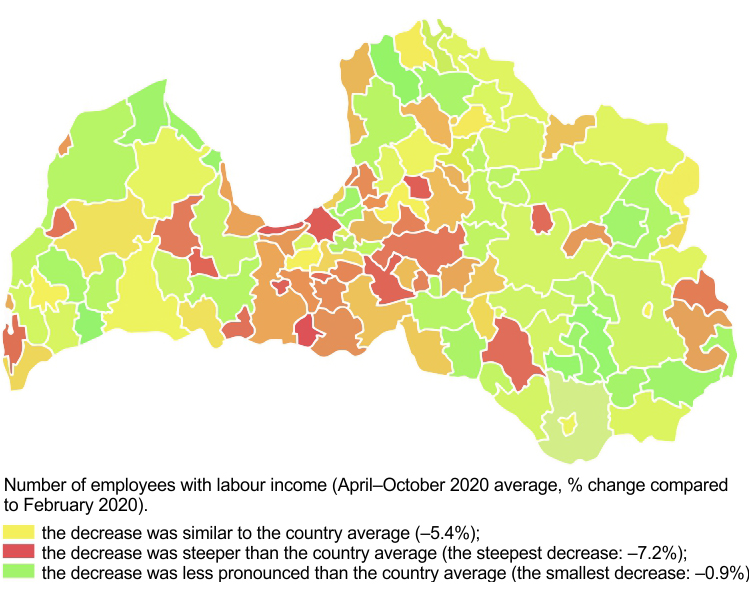
6. The number of jobs decreased mostly in larger cities, especially in Riga and Jūrmala
While the number of jobs decreased in all Latvian municipalities, the decline observed in cities was more pronounced than that in other municipalities. This could be explained both by the economic structure of cities, which is more oriented towards private sector services, and by higher population density [i]. Among Latvian cities, Riga and Jūrmala have suffered the largest layoffs (Figure 7).
Figure 7. Employment changes by municipality (according to employees' declared place of residence; seasonally adjusted data)
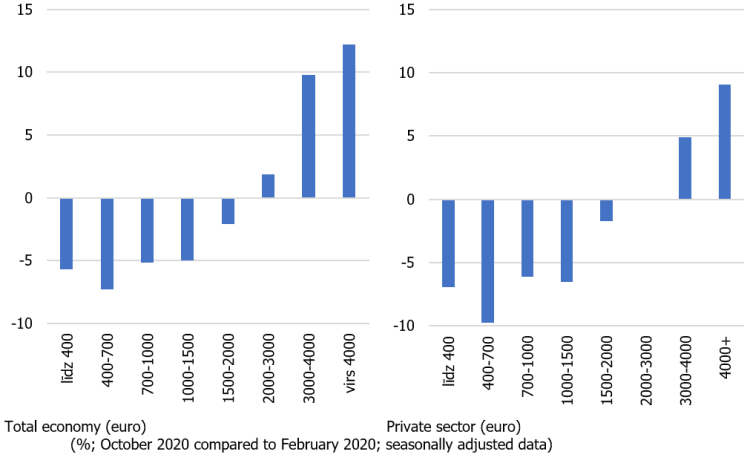
7. Low-wage workers suffered more layoffs
Media headlines pointing to a sustained average wage increase in Latvia may lead to confusion. This phenomenon can be explained by the fact that in any crisis low-wage workers suffer more layoffs. In turn, highly skilled people are usually retained, since employers believe it would be difficult to replace them once the crisis is over. Thus, the 'average wage' may increase simply with the change of the employment structure, i.e. even if no one actually saw any increase in their income.
Consequently, not only have we seen many low-wage workers lose their jobs, but we have also observed the income of some highly skilled people increase during the Covid-19 crisis.
For example, from the beginning of the crisis until October 2020, the number of employees with a gross monthly wage of over three thousand euro increased by more than 10% (Figure 8). Despite the widespread myth that salaries are rising only for public officials, the number of high-wage earners is also growing steadily in the private sector. This confirms the existence of a 'two-speed labour market': at a time when one part of a society cannot find a job, even at low pay, companies continue to hunt for talent and the salaries of their key employees continue to rise. This may further increase the income inequality, which is already high in Latvia.
Figure 8. Employment changes subject to earned gross monthly wage
__________________________
[i] The higher the population density, the more physical distancing rules restrict economic activity. Even with identical rules, the decrease in population mobility was more pronounced in cities than in smaller municipalities (compared to the pre-crisis period).
Textual error
«… …»