Average wages in Latvia: how big, how credible, how relevant they are
The wage problem in Latvia has always been, currently is and will remain on mass media agenda also in the future. The number of analysts attempting to deal with the reasons why average wages continued to grow during the crisis and why wage increase in one sector exceeds that in another is likely to grow. . This article deals with such questions as whether the average wage statistics is the right instrument to unequivocally capture wage dynamics in the economy or, in order to avoid stereotype traps or being ignorant, whether the respective statistical data are to be assessed jointly with a number of other indicators. Likewise, the focus is also on wages and their allegedly high level in the public sector. (I have another article already in mind about whether the existing wage level in Latvia is "too high" or "too low" vis-á-vis productivity and international practices).
What do average wage statistics suggest?
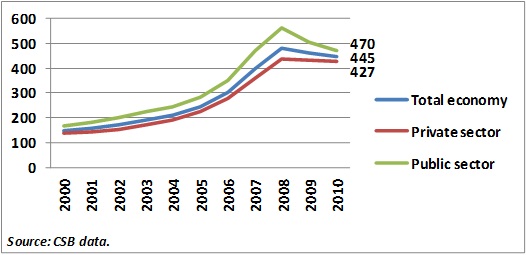
Officially available statistical data indicate that the decrease in the average hourly pay in the private sector during the crisis measured mere 11 lats or 2.5% (see Chart 1 showing 2010 against 2008 data). Local analysts consider, and do it with good reason, this indicator to be unrealistic as the wage drop was broad-based. Foreign economists who, on the other hand, do not question the credibility of wage statistics have a good reason to argue that an insufficient wage drop would be indicative of serious macroeconomic problems, i.e. sticky wages would be an obstacle to regaining competitiveness successfully.
Chart 1. Gross average monthly wages for full-time job (in lats)

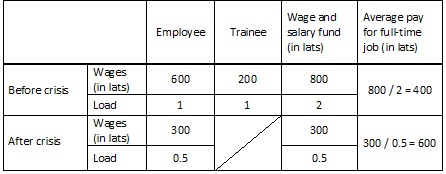
However, the question that now arises is: how likely is it that wages in Latvia would not respond to changes in the economy? As is well known, Latvia's labour market is flexible; hence wages paid are not sticky. They are, according to economic terminology, an effective mechanism for absorbing macroeconomic shocks. In other words, with orders and output falling during the economic crisis, the drop in wages enabled to reduce layoffs as would have been possible if wages had remained unchanged. Then why does the average wage in Latvia in 2008–2010 give an impression of stagnation and stickiness? It is the peculiarities of average wage statistics that are to be blamed and, at the same time, deserve an illustration. Let us assume that before the crisis a company employed a worker and a trainee for a monthly pay of 600 and 200 lats respectively (consequently, the average wage in this company amounted to 400 lats). With the onset of crisis, the trainee was sacked and the worker was shifted to a part-time job, thus "the average wage" (actually the average pay for full-time job) ... rose to 600 lats or increased by 50% (see Chart 1)! It means that at the time when no wage increases were actually implemented (in this example the income fell for both employees) the statistical data suggest a substantial average wage rise. If we assume that in Latvia there were many companies that retained highly-qualified workers during the crisis by reducing their work load (shifting them to part-time jobs), the effects of massive layoffs of low-skilled workers on the average wage statistics can be easily conjectured.
Table 1. Calculation of average wage for full-time job (an illustration)

How much did the wage level actually drop during the crisis? Unfortunately, the available statistical information does not allow assessing in full the structural effects (changes in the structure of employed in the breakdown by education, specialisation, sector, etc) on both average wage data and cross-sector wage discrepancies. Hence without employing other indicators any explanation why the average wage increase is by y% higher in sector A than in sector Z becomes questionable. During crisis, the adjustments to the wage and salary fund for the private and public sectors were similar. Nevertheless, in the public sector (basically public administration and most part of education and health care sectors), they took the form of cuts in hourly pay, whereas in the private sector the adjustments were implemented at the expense of layoffs and work load reductions. Consequently, the more jobs were cut, the larger was the average wage deviation due to structural effects. As a result, the average wage dynamics in the private sector is more "biased" and, consequently, the actual wage reduction during the crisis was steeper than testified by the "average wage and salary" data.
Do wages in the public sector still exceed private sector wages?
Media does not stop spreading the view that pay in the public sector exceeds that in the private sector. At a first glance it may seem right: the level of average monthly wage in Latvia for full-time job in the public sector has been historically higher (see Chart 1). However, the same can be observed in other EU countries as well: on average, the skills required in the public sector are higher. Thus, for instance, to work as physician (predominantly in the public sector) requires higher quality education and stricter requirements than doing waiter's job in the private sector. Herein, wage and salary differences are regularity. (In Latvia's case, public and private sectors' wages and salaries are hardly comparable also because the so-called "envelope (undeclared) wages" are more common for the private sector and will be referred to hereinafter in the concluding part).
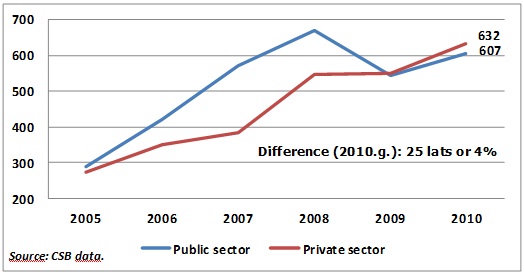
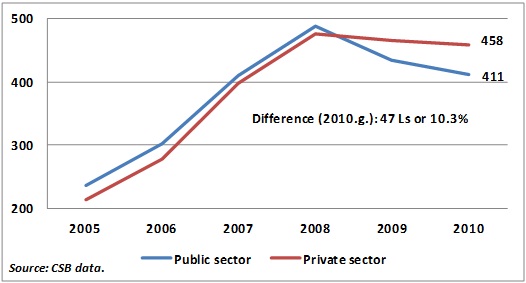
It would be rational to strive for equal pay for similar work of the same quality in both private and public sectors. In most sectors, however, the comparison is not feasible (even if envelope wages are not accounted for), since, for instance, public administration refers solely to the public sector and trade to the private sector. Moreover, the available data are not sufficiently specified to make unequivocal conclusions about the areas of the two sectors for which wage comparisons are possible, e.g. the average wage differences in education may depend on distinguishable work specifics (in the public sector, there are relatively more secondary school teachers, while in the private sector high school lecturers predominate). Despite all shortcomings of the method and average wage deviations due to structural effects, one can get a pretty good idea about the wage and salary trends: the public sector's average wage has substantially dropped in the crisis years in those branches (see Charts 2 and 3) where in the "fat years" the formal average wage had been above that in the private sector, and in 2010, the average pay in the public sector overall was at a relatively low level. For instance, in 2010, the gross average monthly wage for researchers was 4% lower in the public sector than in the private sector, whereas the difference in the health care sector was more than 10%.
Chart 2. Gross average monthly wage for full-time scientific research and development sector workers

Chart 3. Gross average monthly wage for full-time health care workers (in lats)

Let us now return to "envelope wages". It should be noted that the formal wages are compared in Charts 1–3, whereas the wage level, particularly in the private sector, has been underestimated due to the spread of "envelope wages": even in the "fat years" (when the average wage in the public sector was substantially higher), a labour market survey, conducted by the Ministry of Welfare and taking into account the wages paid out in envelopes, stated that in the public sector overall labour remuneration was lower than in the private sector. Thus, the comparatively high gross average wage (before taxes) in the public sector is determined by different shares of branches in private and public sectors as well as by more widely-spread "envelope wages" in the private sector. Consequently, we do not find any evidence that the wages after taxes in the public sector are higher than for the same work in the private sector.
So far we have discussed various number traps and misleading stereotypes. But how consistent is the wage level with productivity in Latvia and how do we compare with other countries? These issues are next to be tackled within the context of economic competitiveness and international environment.
The article was published by Delfi on June 28, 2011.
Textual error
«… …»


