How to Overcome Youth Unemployment: Education vs. Temporary Employment
Summary
Media headlines dedicated to high youth unemployment rates almost everywhere in the world, particularly in the EU. The contribution of this article is twofold. First, it shows that basic youth unemployment rate statistics is in fact a tyranny of numbers and not capable to reflect regions with a real problem. Second, it questions the efficiency of the first remedy that comes to mind – creation of easy, temporary, freelance jobs or subsidizing youth employment and encouraging youth to enter the labour market as soon as possible. All these solutions may indeed have negative long-term consequences. Instead, the preferred policy option is raising the education quality and youth motivation to develop their professional skills. Both contributions are important for the EU Cohesion Policy: how to define the problem regions and how youth unemployment problem should be resolved.
1. Youth unemployment rate – just a tyranny of numbers?
The situation with the youngsters' position in the labour market is much less clear than it seems at first glance. What lies behind the dismal unemployment numbers? The dismal media headlines rely on two figures that form a common base for the youth unemployment debate.
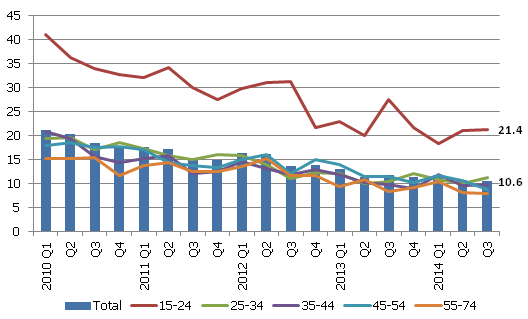
First, the job seekers' rate among youngsters in Latvia (21%) is twice as big as among other age groups. Unemployment rate halved among all age groups since the trough of the crisis, but youngsters' unemployment rate is unchangeably ahead (see figure 1).
Figure 1. Unemployment rate in Latvia by age group (% of economically active population)
Source: Central Statistical Bureau of Latvia data; author's calculations
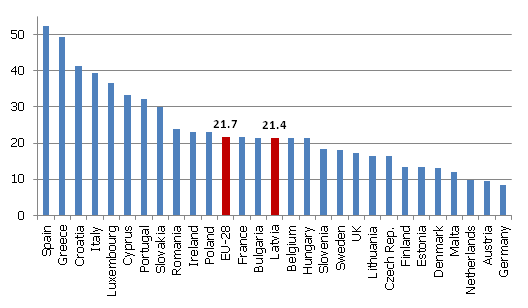
Second, a similar story applies to the other EU countries as well. On the one side, Greece and Spain are leaders with a 50% youth unemployment rate, leading to breaking but improper headlines "every second youngster without a job". On the other side, there are three countries where the youth unemployment is below 10% - Germany, Austria and the Netherlands, with economists continuing to figure out the roots of their "miracle". Latvia stays in between with youth unemployment rate very close to the EU average (see figure 2).
Figure 2. Youth unemployment rate in Q3 2014 (% of economically active population; age group 15-24)
Source: Eurostat data
Normally these two arguments are the only ones in the politicians' portfolio regarding youth unemployment, followed by emotional speeches on "the lost generation", etc. In reality, however, unemployment is no more widespread among youngsters than among other age groups.
For instance, the most recent Labour Force Survey data (2014 Q3) shows that there are 210 thousand people of age 15-24 in Latvia. Of which, more than half were not economically active (mainly studying). The remaining 88 thousand are regarded as participating in the labour market (economically active), which may be further divided by 69 thousand employed and 19 job seekers or unemployed. The ratio of job seekers to economically active youngsters (19 / 88) is the dismally famous 21% unemployment rate. I wonder, however, whether due to 19 thousand youngsters seeking for a job (of which only 7 obtained the official unemployed status within the State Employment Agency, and, thus, have opportunity to participate in "Youth Guarantee" scheme and other programs), the misery label could be attached to all 210 thousand Latvian youngsters (see table 1).
Table 1. Participation of Latvia's youngsters (aged 15-24) in the labour market in Q3 2014 (thousand)
| Total | 210 |
| Economically inactive (mainly studying) | 122 |
| Economically active | 88 |
| Employed | 69 |
| Unemployed | 19 |
| Registered in the SEA | 7 |
Source: Central Statistical Bureau of Latvia data and State Employment Agency data
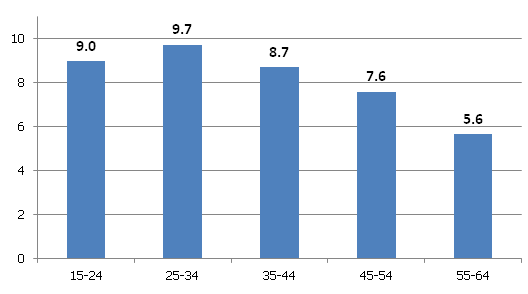
Instead, if we measure unemployment rate as the share of job seekers to total population in the respective age group (not just economically active population), unemployment prevalence within 15-24 age group (19 / 210 = 9%) is broadly similar to 25-44 age group (see figure 3).
Figure 3. Unemployment rate by age groups in Latvia in Q3 2014 (% of total population in the respective age group)
Source: Central Statistical Bureau of Latvia data; author's calculations
Therefore, dismal youth unemployment figures mainly reflect low labour market participation. To see how participation rate can affect youth unemployment cross-country differentials, let's look at a hypothetical example. If only 1% of youngsters were studying, the remaining 99% would be rather successful in the labour market (high participation rate case). First, if the majority of population would be uneducated, being low-educated would not be a disastrous signal to the employer. Second, many capable and talented young people would obviously be among the 99%. Conversely, if 99% youngsters were studying (low participation rate case), the remaining 1% would definitely be out of work since employers would be free to hire educated workers.
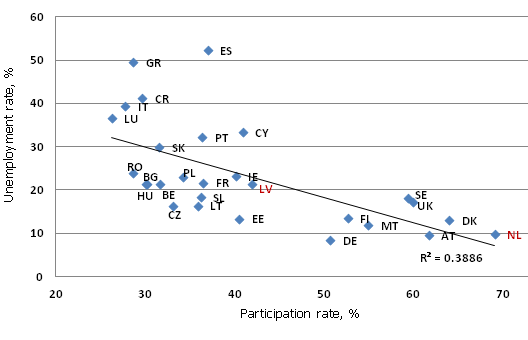
Indeed, there is a strong negative correlation (-0.62) between youth participation and youth unemployment rates (see figure 4). In the EU context, this example could explain "the miracle" of the Netherlands, and partly also the low youth unemployment rates in Germany and Austria. For instance, consider Latvia with 42% participation rate and 21% youth unemployment rate. It may be argued that youth unemployment rate in Latvia would be close to that of the Netherlands (below 10%) if youth participation rate would have been similar to that in the Netherlands (69%). The relation between the youth participation and unemployment rates is strong also in the longer term (for instance, we may have used 10-year average participation and unemployment rates and obtain similar results).
Figure 4. Youth participation and unemployment rates in Q3 2014 (%)
Source: Eurostat data; author's calculations
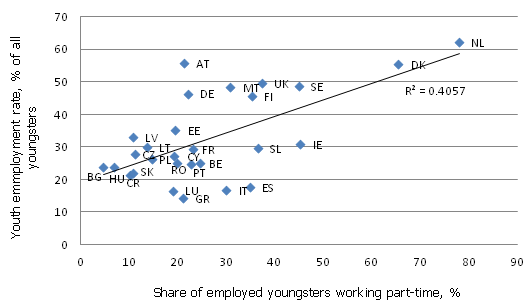
Why some countries achieve higher youth participation rates than others? In some countries (e.g., the Netherlands) it is common for youngsters to work part-time so they can continue studies after entering the labour market. Unsurprisingly, the youth employment rate in these countries is higher than in Latvia where the society is not accustomed to a flexible job schedule, thus many youngsters have to choose between studies and a full-time job (see figure 5).
Figure 5. Youth employment rate and the share of youngsters working part-time in Q3 2014
Source: Eurostat data; author's calculations
Whether there is a better indicator to identify problem regions / countries in respect to youth transition from education to the labour market? In fact, yes. NEET (youth not in employment, education or training) statistics should be given priority. Despite its strong correlation with the youth unemployment rate, it is more complex indicator. While the high share in NEET of those who would like to work (seeking employment or not) may reflect current labour market conditions (for instance, Spain and Greece), even more important (structural, cultural) problem may be the high share of young people who do not want to work. The top two countries in the latter respect are Bulgaria and Romania - note that in both countries youth unemployment rate is close to the EU average, therefore, youth unemployment indicator is not capable to highlight important problems in these counties.
2. What is the best solution - education or temporary employment?
If youth unemployment rate may be scaled down with raising youth participation rate, should it be done? Quite often we hear (mainly from low-skilled labour employers) innocent calls to integrate pupils and students into the labour market since "everybody is studying useless things while we have a labour shortage". If studies really were useless (and even were not a positive signal to employers) we would see similarly high unemployment rates among high- educated and low-educated people. In reality, however, education does improve performance in the labour market by significantly reducing unemployment risk (much more than low-skilled job experience) and increasing wages.
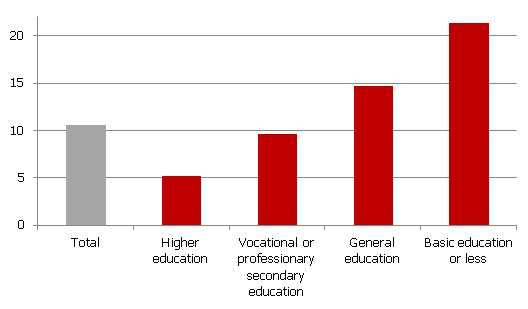
Consider the case of Latvia where unemployment rate among those with higher education is twice lower than among people with vocational or professionary secondary education diploma, three times less than among those with general education and four times less than among those with basic education (see figure 6). Moreover, more education is associated with higher participation rates and therefore, also employment rates.
Figure 6. Unemployment rate by education level in Latvia (Q3 2014; % of economically active population)
Source: Central Statistical Bureau of Latvia data; author's calculations
It should be mentioned that education choice may not be exogenous and may reflect many unobserved soft skills that are likely to have an impact on unemployment and participation rates themselves. However, the picture above still may show that education is associated with higher labour market participation and lower unemployment. Moreover, the vast majority of unemployed youth are people with poor education. High youth unemployment rate reflects poor education of economically active young people, not youth as a disadvantaged group.
The primary aim of the first job experience under "Youth Guarantee" program should be to raise youth motivation to continue their professional development. At the contrary, provision of low-skilled temporary subsidized job opportunities, while improving labour market statistics in the short-run, may have a detrimental effect in the long run both by decreasing tertiary education attainment and by providing bad (demotivating) first job experience. In some occasions, bad job experience may be worse than no experience at all.
Even well-established dual vocational training (on-the-job learning) systems are not without drawbacks. For instance, in Germany, after completing compulsory lower secondary education, young workers can sign a training contract with the private company, which includes spending 3-4 days per week in a workplace and 1-2 days in vocational school during the next 2-3 years. However, even effectively run systems that look fine from a partial equilibrium point of view, may have its drawbacks in a general equilibrium setup. For instance, German dual vocational training system is believed to have long-term costs for society by decreasing tertiary education attainment (Banerji et.al., 2014). If tertiary education significantly reduces unemployment risk, it is possible that dual vocational training system eliminates unemployment of its trainees during the early working life, but increases unemployment risk afterwards. Therefore, authorities should not stimulate Latvian pupils and students to enter the labour market at the expense of studies.
The next question to consider is how strongly authorities should influence the choice of education field. Claims of "overproduction" of university graduates in social sciences, business and law are well-known in Latvia for at least ten years. However, the unemployment prevalence among the graduates of the respective field is very close to the average among higher education graduates and is substantially less than among persons with general education (Ministry of Economics, 2014; p. 31-32).
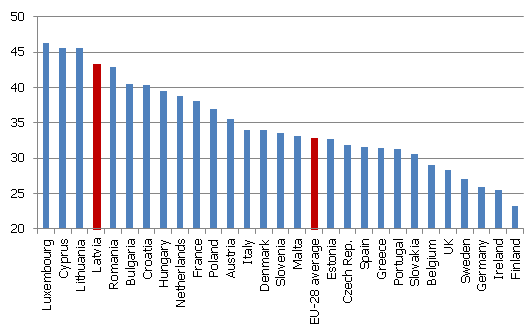
It is true that the share of students studying social sciences, business and law is still high in Latvia according to the international standards. But does it necessarily points to disequilibrium situation? Apart from Luxembourg and Cyprus, which may be regarded as outliers, the upper part of the list consists of post-transition economies, where the high share of social sciences is likely to represent a shortage of the respective professions in the planning economy (see figure 7).
Figure 7. Share of tertiary education students studying social sciences, business and law (in 2012)
Source: Eurostat data; author's calculations
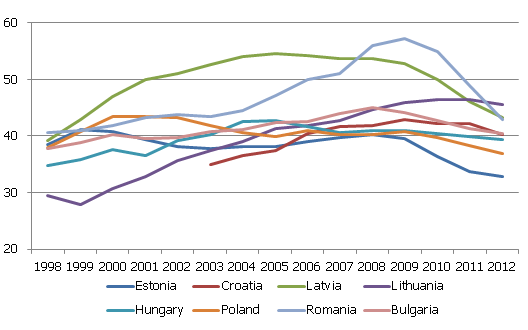
Furthermore, the share of students studying social sciences is decreasing sharply in almost all post-transition economies, rapidly converging to the EU average, particularly in countries that experienced the highest share in the past (Romania and Latvia; see figure 8).
Figure 8. Share of tertiary education students studying social sciences, business and law (East-European countries, 1998-2012)
Source: Eurostat data; author's calculations
It is not clear by which extent the decrease of the share of students studying social sciences is self-correcting (larger supply is decreasing private returns from education) and by which extent these developments could be attributed to the government policies aiming to correct "overproduction", particularly by managing the allocation of state-funded places in universities by the fields of studies. For instance, in Latvia the share of state-funded places is the lowest in social sciences, business and administration (12%), while it exceeds 70% in natural sciences, mathematics and computing (Ministry of Economics, 2013; page 30). While the Ministry of Economics supports further reallocation of state-funded places to the fields of natural sciences, mathematics and computing (Ministry of Economics, 2014; page 85), the question remains, however, by how much this allocation may have changed the flows of talented secondary school graduates (highly demanded by the private sector), not only the flows of state-funded place hunters, potentially raising the drop-out rate and scaling down the education standards in heavy-subsidized fields of education. Further research is needed to evaluate the effectiveness of state-funded place allocation management.
Given unclear impact of "quantity management", authorities should primarily focus on "quality management" - promote the quality of education, using EU Cohesion Policy tools where applicable. One of the first steps in this direction would be unprejudiced evaluation of the quality of existing study programs. Previous attempts ended with ambiguous results (Ministry of Education, 2012). The problem may be hindered in a formality and subjectivity of high education assessment as well as complex interrelations between the program owners and examiners. For instance, dividing programs by three groups – "sustainable", "need to improve" and "of questionable usefulness" could be too general and ambiguous guide for perspective students. Perhaps, better option might be to compare similar study programs on the basis of graduates' polls/interviews (up to 10-20 years after graduation), including their job experience during all time span after graduation and current wage level, as well as subjective assessment by which extent the respective program had raised their labour market performance. Even better solution would be to maintain and regularly update the database of work experience and wages of particular graduation cohorts. To my knowledge, no university in Latvia has such a database of its graduates.
Similarly, there is a room for improvement of the quality of general and vocational education. OECD (2014) shows that Latvian pupil' achievements in mathematics, reading and science are substantially behind that of EU top-performers Finland and Estonia. Particularly, teachers-to-pupils ratio historically have been high in Latvia, but teacher wages – low, even given its GDP per capita.
To sum up, redistribution of EU funds to combat the youth unemployment could still be beneficial if these measures improve education and/or skills of young people (rather than result in employing one group of youngsters to excavate a trench and another group to fill up the trench in order to obtain a short-term improvement in youth unemployment figures). New job places for youngsters should not be low-skilled since such would only demotivate them from developing their professional skills, thus increasing the number of social benefit recipients in the future. Moreover, many practical skills (for real life, not only for grade) should be obtained at school. It may look funny if after 12 years at school a young person needs computer proficiency, foreign language and CV writing courses in order to enter the labour market.
Conclusions and recommendations
Despite the "lost generation" talks, actual unemployment prevalence among young people is broadly similar to the other age groups. Rather it is low youth participation rate that results in a dismally high youth unemployment figures as unemployment is officially calculated as a job seekers to economically active population ratio.
Furthermore, participation rate matters for the unemployment rate cross-country differentials among the EU countries. Higher youth participation rate is associated with lower youth unemployment rate. Low youth unemployment miracle of Germany, Austria and the Netherlands at least partly reflects high youth participation rates in these countries, thus, raising ambiguity of youth unemployment rate international comparisons. High youth participation rates go hand-on-hand with the part-time job prevalence.
Youth unemployment figures could be brought down by raising youth participation in the labour market, but this should not be done at the expense of studies. There is evidence that more education is associated with lower unemployment. Therefore, it is possible that providing young people with subsidized temporary low-skilled jobs may refrain them from studies, and thus, may have detrimental long-term consequences, raising their probability of unemployment in the future. Alternatively, EU Cohesion Policy should primarily focus on rising the quality of education as well as motivation of young people for their professional development.
References
Ministry of Economics of the Republic of Latvia (2013). Informative Report on Labour Market Medium Term and Long-Term Forecasts (in Latvian; 67 pages). Informatīvais ziņojums par darba tirgus vidēja un ilgtermiņa prognozēm. 2013. gada 21. jūnijs.
Ministry of Economics of the Republic of Latvia (2014). Informative Report on Labour Market Medium Term and Long-Term Forecasts (in Latvian; 120 pages). Informatīvais ziņojums par darba tirgus vidēja un ilgtermiņa prognozēm. 2014. gada 15. augusts. Available in the Internet:https://www.em.gov.lv/files/tautsaimniecibas_attistiba/EMZino_150814.pdf
Ministry of Education of the Republic of Latvia (2012). Studiju programmu iedalījums grupās pēc ekspertu vērtējumiem. Available in the Internet: http://www.aip.lv/ESF_projekts_publ_29.htm
Banerji A., Saksonovs S., Lin H., Blavy R. (2014). Youth Unemployment in Advanced Economies of Europe: Searching for Solutions. IMF Staff Discussion Note SDN/14/11. 32 pages. Available in the Internet:http://www.imf.org/external/pubs/ft/sdn/2014/sdn1411.pdf
OECD (2014). What 15-year-olds know and what they can do with what they know. Available in the Internet: http://www.oecd.org/pisa/keyfindings/pisa-2012-results-overview.pdf
Textual error
«… …»


