

Surfing the Trade-Off Between Safety and Efficiency: How Much Capital Does a Bank Really Need?


In short
-
The optimum level of Tier 1 capital for Latvia is between 15% and 17%.
-
Given the current level of bank capital requirements, there is still room to increase resilience buffers by around 2–3 percentage points while ensuring that the long-term benefits for GDP growth outweigh the costs.
-
Further increases in releasable capital buffers would yield additional long-term benefits for the economy.
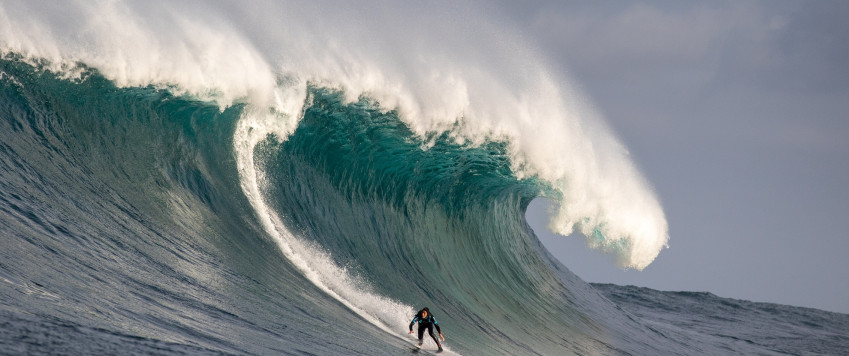
In surfing, the greatest challenge is not finding the biggest wave, but finding one that allows you to maintain your balance and move forward with confidence. The same applies to banking. Regulators impose capital requirements to ensure that banks can withstand economic storms and unexpected losses. Yet excessive capital holdings can come at a cost, reducing profitability by limiting the resources available for lending and other income-generating activities.
In this story, the waves symbolise the economic environment, which is constantly changing with the business cycle. The surfboard, in turn, represents a bank's capital. The larger the board, the better equipped the bank is to withstand adverse conditions, but at the cost of higher expenses and reduced flexibility in seizing profit opportunities. A smaller board makes it easier to harness the power of the wave, yet it also increases the risk of losing balance. Equally important are the surfer's chosen manoeuvres, which in the banking world correspond to a bank's risk appetite and business strategy.
By setting the level of capital requirements, supervisory authorities influence banks' decisions regarding their overall capital levels, or, in surfing terms, the size of their surfboards. The objective is to ensure that banks maintain sufficient resilience buffers and a low level of risk without imposing disproportionate capital maintenance costs on the banking sector. In Latvia, this responsibility is shared by Latvijas Banka and the European Central Bank (ECB).
One of the stages of the analysis in this process involves assessing the optimal level of capital by comparing its long-term benefits and costs. More specifically, the analysis focuses on so-called marginal benefits and marginal costs, that is, the benefits and costs associated with increasing capital by one percentage point. If the additional safety benefits exceed the associated costs, a higher level of capital is justified. If not, the existing level of capital is likely sufficient.
For Latvia, with a focus on GDP growth, the analysis suggests that the optimal Tier 1 (T1) capital ratio [1] is 16.2%, with estimates ranging from 15.3% to 16.4% (Figure 1). In the second quarter of 2026, the average T1 capital requirement across the banking sector stood at 13.6%, and no bank faced T1-based capital requirements exceeding 15%. At the same time, banks voluntarily maintained an average T1 capital ratio of 18.9% [2]. This suggests that there remains scope to usefully increase releasable resilience buffers by 1.7–2.8 percentage points, should the need arise. Such an increase in capital requirements could still generate long-term benefits that outweigh the associated long-term costs. Returning to the surfing analogy, this would correspond to a surfboard that is both stable enough to weather rough conditions and agile enough to manoeuvre effectively.
And Now, Let’s Take It Step by Step
The optimal level of capital is determined by comparing the additional long-term benefits (marginal benefits) and additional long-term costs (marginal costs) associated with raising capital requirements. The resulting net marginal benefit therefore captures the economic effect of a small increase in capital (one percentage point) and is calculated as the difference between the additional benefits and the additional costs. Using the approach employed by McInerney et al. (2022) [3], the net marginal benefit of higher capital requirements is calculated as follows:
The intuition behind the equation is relatively straightforward. The first two components capture the additional benefits of higher capital levels: they reduce the likelihood of financial crises and, consequently, the potential economic losses associated with them. In other words, crises are expected to occur less frequently or to be less severe. Accordingly, GDP growth is either not disrupted or the slowdown is less pronounced. The third component captures the additional costs, namely the reduction in GDP growth associated with raising and maintaining bank capital. Higher capital levels can increase the costs of lending and reduce lending volumes, both of which, in turn, slightly dampen economic growth. The optimal level of capital is therefore reached when the additional benefits of a safer financial system no longer exceed the additional costs imposed by stricter capital requirements.
Storm Ahead? What Irish Banking Researchers Say About the Probability of Financial Crises
To assess the value of additional resilience, we must first estimate how often the economy is likely to encounter storms, in other words, financial crises. This requires estimating how the probability of a financial crisis changes as bank capital levels vary.
This study draws on the estimates reported by McInerney et al. (2022) [3], which quantify the probability of a financial crisis at different bank capital levels. In addition, the analysis uses estimates specifically developed for small open economies and for countries with a high share of foreign direct investment. The crisis probability assessment that is the most relevant for the Latvian economy (i.e. that for a small, open economy) was used as the baseline scenario, while the other selected scenarios were used as the assessment range (Figure 2). The higher the capital level, the lower the probability of a crisis. As a result, the decrease in the probability of a crisis is calculated as the difference in the probability of a crisis, when the capital level increases by 1 per centage point.
As Figure 2 shows, crisis probabilities decline more rapidly when capital buffers are exceptionally low and more gradually once capital levels exceed the minimum regulatory requirements. Yet the probability of a storm is only part of the picture. Its potential economic cost must also be considered.
If the Storm Hits: How Costly Is It?
Even an infrequent storm can leave a trail of destruction if it strikes with sufficient force. Latvia has also experienced its share of financial storms. The impact is clearly visible in the country's GDP fluctuations. In 1995, Latvia experienced a banking crisis, during which the operations of several banks, including Banka Baltija, were suspended and a number of banking licences were revoked. Then, in late 2008, Latvia, together with many other countries, was shaken by the global financial crisis [4].
To assess the potential GDP losses in Latvia caused by a crisis, data on real GDP during the global financial crisis and the post-crisis period (the dark blue line in Figure 3), as well as data on the GDP trend from the third quarter of 1996 to the fourth quarter of 2004 (the pink line in Figure 3) were used. This is the period between the 1995 banking crisis and the rapid growth before the global financial crisis. The estimated trend is similar to the GDP dynamics observed in Poland (the light blue line in Figure 3), where GDP grew steadily during this period.
In mathematical terms, the following equation is used to calculate the GDP loss:
Once the storm has passed and the crisis is over, its effects can linger for many years. The economy needs time to return to its pre-crisis growth path, meaning that the costs of a crisis include not only the immediate contraction in economic activity but also a prolonged recovery period. To estimate the length of this post-crisis period for Latvia, we compared the pre-crisis GDP trend derived earlier with the post-crisis GDP trend (relatively stronger growth was observed between the fourth quarter of 2014 and the fourth quarter of 2015). The two trend lines intersect at the end of 2037. Accordingly, we assume that the post-crisis effect lasts for 26 years, defined as the period until the post-crisis GDP trend catches up with the pre-crisis trend.
Putting the pieces together allows us to estimate the cost of a crisis for Latvia. Our results suggest that the cumulative GDP losses associated with the global financial crisis (from the second quarter of 2009 to the first quarter of 2012) and the subsequent post-crisis period amount to 215% of GDP. In line with standard practice in the literature, these estimated GDP losses should be interpreted as an upper bound on the economic costs of a crisis.
What Is the Cost of Additional Resilience?
No surfer would choose an infinitely large board simply to feel safer. The same trade-off applies to bank capital: greater resilience comes at the cost of a reduced ability to make full use of the opportunities provided by the economy. This trade-off is reflected in the additional long-term costs of raising capital requirements, known as marginal costs.
As two of Latvia's major financial institutions are subsidiaries of Swedish banks, data on Swedish credit institutions were used in the assessment of the marginal costs of increasing the capital. The assessment by Sveriges Riksbank was used as the baseline. According to this assessment, an increase in the capital requirements by 1% may result in a long-term decrease in GDP by 0.09%. Compared to studies from other countries, this is a conservative estimate. The table shows that most other studies estimate lower costs.
Table. Estimated Marginal Costs of Raising Capital Requirements from Selected Studies
| Study | Country | Effect on GDP (%) |
| McInerney et al. (2022) | Ireland | –0.04 to –0.05 |
| Almenberg et al. (2017) [5] | Sweden | –0.09 |
| Brooke et al. (2015) | UK | –0.01 to –0.05 |
| Firestone et al. (2019) | US | –0.08 |
| FRB Minneapolis (2017) | US | –0.06 |
| Cline (2016) | US | –0.08 |
The analysis shows that the impact of capital requirements differs across banks: for systemically important banks [6] higher capital entails lower additional costs than it does for smaller banks. To determine the slope and range of the marginal cost curve, we used data on the funding costs of Latvian banks from 2006 to 2025. For large banks, particularly those benefiting from the support of parent banks, funding costs remain low and stable regardless of capital levels. By contrast, for smaller banks, higher capitalisation is associated with higher overall funding costs. Taken together, the results reveal a clear correlation between banks' capitalisation levels and their total funding costs.
The purpose of this analysis is to estimate the optimal level of capitalisation for Latvia's banking sector, at which the long-term marginal benefits of maintaining capital are balanced against the marginal costs. The results suggest that the capital requirements currently imposed by Latvijas Banka remain below the optimal level at which additional safety benefits diminish. In other words, the existing requirements do not appear excessive. Furthermore, all banks also maintain voluntary capital buffers above the regulatory requirements.
The authors are grateful to the Central Bank of Ireland researchers Niall McInerney, Martin O'Brien, Michael Wosser, and Luca Zavalloni for sharing detailed results from their financial crisis probability calculations.
[1] Tier 1 capital is a bank's core capital and the primary measure of its financial strength, serving as the first line of defence against losses while the bank remains a going concern. It consists of the highest-quality forms of capital, primarily common equity and retained earnings, which enable a bank to absorb unexpected losses arising from its day-to-day operations and thereby avoid insolvency.
[2] In the second quarter of 2026, the average Tier 1 capital ratio of significant institutions (Swedbank AS, AS SEB banka, and AS Citadele banka) was 19.0%, while the average volume of requirements to be met with Tier 1 capital amounted to 14.0%.
[3] McInerney, N., O'Brien, M., Wosser, M., & Zavalloni, L. (2022), Rightsizing Bank Capital for Small, Open Economies, Research Technical Paper, Central Bank of Ireland, Vol. 2022, No. 4.
[4] According to the information contained in the ESRB's European financial crises database, the global financial crisis hit Latvia in November 2008 when the government took over AS Parex banka and ended in March 2012.
[5] Almenberg et al. (2017), Appropriate capital ratios in major Swedish banks - new perspectives, Staff Memo, Sveriges Riksbank, May 2017.
[6] Swedbank AS, AS SEB banka, and AS Citadele banka.
Textual error
«… …»