
Comparison of the Baltic States' exports
For Latvijas Banka Monthly Newsletter, In Focus, July, 2017


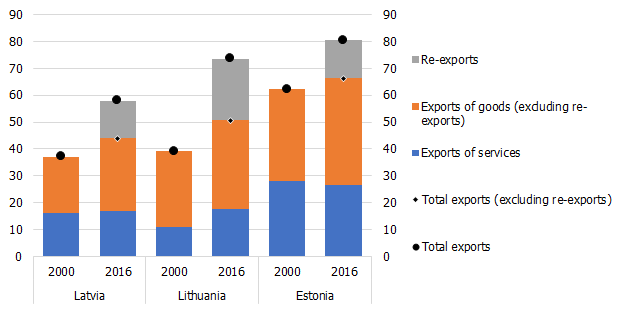
In 2016, exports of services and goods accounted for 58%, 80% and 74% of GDP in Latvia, Estonia and Lithuania respectively. In this respect, Latvia historically falls behind both neighbouring countries, and its recent growth has not helped Latvia to catch up with Lithuania and Estonia. In 2016, the large difference between Latvia and Lithuania was mainly due to re-exports (see the Chart).
The market share of Latvia's exports of goods in global imports is expanding at a faster rate than that of the other Baltic States suggesting an improvement in Latvia's competitiveness. However, the volume and the value of goods exported from Latvia are still lower compared to exports from Estonia and Lithuania. In 2016, almost two thirds or 29% of all goods exported from Latvia were sold in its neighbouring Baltic States, i.e. Estonia and Lithuania, while the share of goods exported from Lithuania and Estonia to the other Baltic States only accounted for 15%. In the course of the last decade, Lithuania, Estonia and Russia have been Latvia's major export partners. The adverse impact of Russia's sanctions and of its weakening demand on Latvia's exports decreased, as it was gradually offset by businesses penetrating new markets. As a result, the share of Latvia's exports to Russia declined. The top three destinations of Estonia's exports are Sweden, Finland and Latvia, while the major export partners of Lithuania are Russia, Latvia and Poland.
Machinery and transport vehicles and their parts account for the largest share of the Baltic States' exports. However, this commodity group constitutes a significantly larger share in Estonia's exports and GDP in comparison with Latvia and Lithuania. Latvia's exports of goods mainly differ from those of Estonia in terms of the share of machinery in total exports, whereas from those of Lithuania in terms of the share of mineral products and products of the chemical industry.
Although the share of high-tech products in Latvia's exports has increased in recent years, it still falls behind the respective share in Estonia's exports. High- and medium-tech products account for 40% of Estonia's total exports; meanwhile, these products constitute less than one third of Lithuania's and Latvia's total exports. Products which undergo little processing still account for a significant share of Latvia's exports.
In 2016, the share of exports of services was similar in Latvia and Lithuania representing 17% of GDP, while the services exports of Estonia constituted 26% of GDP. IT services, telecommunication services and other business services have been the fastest growing services sectors in the Baltic States over the past few years. Transportation services play a major role in exports of all three Baltic States. Besides, a characteristic feature of Latvia's exports of services is exports of financial services. In addition to that, although the contribution of financial services to Latvia's exports of services is modest, it is still significantly larger than in the other two Baltic States. Meanwhile, Estonia outpaces the other Baltic States with respect to travel services, business services and construction services. Lithuania, in turn, clearly holds the leading position with respect to transportation services. In the post-crisis period, the share of Latvia's exports of transportation services in global imports has declined year by year, whereas the respective share of Lithuania's exports has increased sharply. The market structure of Latvia's and Lithuania's exports of services is more diverse compared to that of Estonia exporting almost one third of its services to Finland.
The differences in the structure of exports of goods and services and in the choice of cooperation and trade partners can be largely explained by historical reasons, the geographic location and the neighbouring countries of each Baltic State, as well as by their success in drawing investment to ensure the development of manufacturing and services sectors and facilitate long-term economic growth.
Textual error
«… …»