Latvian manufacturing in cross-section
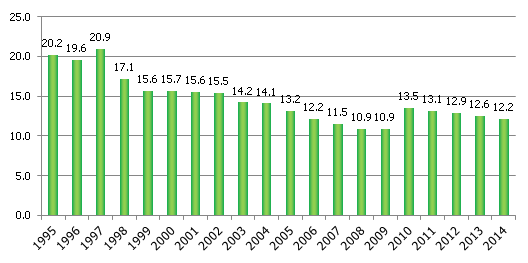
Even though the Latvian manufacturing in the postcrisis years has developed in a relatively dynamic way, its share in the added value of the total economy has dropped. Particularly the last two years have been challenging for the sector: problems are observed both in the western export markets (the weak and unsustained growth of the euro area countries) and in the east (the weakening of the economies of Russia and the other CIS countries as well as of the Russian rouble; the economic sanctions). The largest (at least in terms of output) enterprise of the sector, "Liepājas metalurgs", was lost, which, owing to an active involvement of the state and a relatively successful insolvency process, is gradually resuming work in 2015, yet the questions regarding the future of the enterprise remain. Because of the factors outlined above and a faster growth of other sectors of the economy, the proportion of manufacturing in the total added value has been contracting for four consecutive years. This is in total contrast to the relatively recent plans of the economic policy makers to increase the proportion of the sector by 2020 to 20%.
Using SBS (Structural business statistics) data, I will discuss in this article, what the Latvian manufacturing looks like broken down (by sub-branch) and compared to other European Union (EU) member states. The goal of this article is to understand where and by how much we are lagging and what could be improved.
I will structure the article as follows: at the beginning, I will look at the SBS data and their properties that have to be taken into account when evaluating the results of these data. Usually I do not pay much attention to the technical nuances of the data, but here it is necessary because of the properties of the data. In the core part of the article, I will analyze the SBS data, comparing them with those of other EU member states, highlighting the most interesting (in my opinion) aspects from which these data can be viewed. I must say that the available amount of data is massive. That means that the ways of depicting the data and the conclusions are but a tiny part of the possible analysis. In the final part of the article, I will suggest possible conclusions for economic policies that can, in my opinion, be made from the SBS data and what should possibly be researched further, using the microeconomic data.
Introduction In 2014, the added value of manufacturing at constant prices dropped by 0.3% (the output at constant prices dropped by 0.1%). True, the relatively unsuccessful performance of manufacturing in 2014 was primarily determined by the developments in the external markets (and, in part, the stoppage at "Liepājas metalurgs"), yet it is also obvious that the results of recent years hardly leave any hope of reaching the goal of the 20% share in the added value. It seemed very difficult to achieve the goal even at the moment of setting it, but now it is absolutely clear that in the absence of unexpected positive developments in the economy it will not be reached. It however does not mean that there is no point in trying to reach another, lower goal. The goal of 15-16% would at the moment be sufficiently objective – difficult to achieve, yet possible.
Fig. 1. Share of manufacturing in the total added value, % (current prices)
Data source: Central Statistical Bureau
Economic analysts usually devote increased attention to the manufacturing sector. It is a rather precise indicator of the overall situation in the economy: the successes or failures often indicate the processes that are likely to affect the economy at large. The output data and so-called soft data (confidence indicators, data of various surveys) are often used in constructing operative macroeconomic models in which they play a significant role. It is therefore hardly surprising that the sector is important not only to analysts but also from the point of view of statisticians.
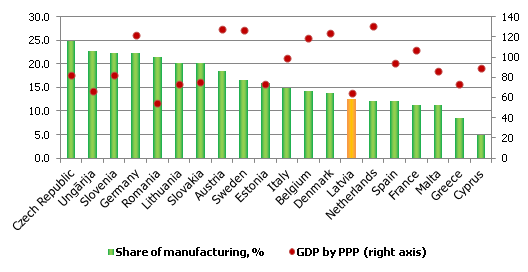
Yet sometimes the significance of the share of manufacturing in the structure of added value seems too glorified. True, at the European level, Latvia has a relatively low share of manufacturing in the total added value of the economy. Yet, as is seen from Fig. 2, there is no unequivocal connection between the share of manufacturing in the total added value and the overall welfare of the economy. Even the reverse seems true: a higher GDP (expressed in terms of parity of purchasing power per one inhabitant) is in the group of countries with a smaller share of manufacturing in the structure of the added value of the economy. Times change and gradually the economy changes as well. Nowadays, the service sectors – trade, real estate, transport – also are of very great significance. As far as manufacturing is concerned, it has not lost its importance; simply its structural aspects have become much more important, i.e. the productivity of the sector; gross operating surplus, its energy intensity and knowledge capacity etc. In all likelihood, the successes and failures of manufacturing will long continue to be judged by its share in the economy, for it is the accepted practice – the common way of assessing the significance and "health" of the manufacturing sector. It is a rather primitive way, however. The various structural indicators, in my opinion, are much more important.
Figure 2. The share of manufacturing in total added value in EU countries, % (current prices, 2013) and GDP of relevant countries expressed by purchasing power parity, % of EU average
Data source: Eurostat
The Latvian Central Statistical Bureau (CSB) publishes a variety of different indicators regarding the manufacturing sector – both the direct indicators of the sector (output, turnover, directions of sales etc.) and the indicators of other areas of the economy, for instance, the indexes of producer prices, unemployment, compensation, economic conjuncture, surveys of enterprises, etc. All of these indicators tend to be useful to analyze the dynamic of manufacturing – i.e. which indicator and by how much has improved/deteriorated compared to some period in the past. That allows the analysts of Latvijas Banka and other institutions to follow the developments in the economy and publish operational reports and comments. These relatively operative indicators are very often used in the operational models of central banks, in which the GDP projections for the current or next quarters are assessed. It is all very useful, but in this article, I would like to consider a hitherto less discussed and used data aspect that allows a view of a cross-section of manufacturing, moreover, comparing its functioning with its counterparts in Europe. This is possible using the Entrepreneurship indicators in industry aggregated by the CSB and published by Eurostat [1] or, in Eurostat databases in English, the Structural Business Statistics (henceforth, SBS).
SBS data, their advantages and shortcomings
Usually I do not spend much time describing the properties of data in my articles, but in this case, it is important to understand what these data indicate and therefore, before getting to the analytical part, I will provide a brief introduction on the essence of the SBS data.
A great advantage of SBS data is that they allow an insight into the manufacturing sector almost at the level of microdata. That is, information on manufacturing is available at the level of four digits, which means data expansion regarding 230 sub-branches in manufacturing alone. Overall, the SBS data can be divided into three relative groups:
- Indicators of business demographics, describing the dynamic of the number of businesses in the sub-branches;
- Output related indicators that reflect the dynamic of turnover and added value;
- Input related indicators that describe the resources "consumed" in manufacturing a product or providing a service (employment, the amount of raw materials purchased, capital investments, etc.).
The target population of SBS data surveys are all the economically active enterprises whose number of employees, annual turnover, or total balance exceeds a set base quantity. The base quantities are defined as follows:
- The base number of employees is equal to 50;
- The base quantity of the annual turnover and total balance are defined based on the type of economic activity of the enterprise and the reporting year;
- The rest of the enterprises, which, by the set indicators do not exceed any base quantity, are surveyed selectively. Moreover, it should be kept in mind that data on economically active self-employed persons are also included.
The broad accessibility of the indicators (added value, gross fetching (profit), personnel costs, energy costs, investment broken down by type etc.), not available in so much detail in the national account statistics, should also be considered as an advantage. Another advantage is the fact that the data can be compared with the other EU countries, thus expanding the horizons of data analysis to an international level. Given the "depth" of the data (four digit level + many different economic indicators) and their breadth (EU member states), the possibilities for analysis are almost inexhaustible.
The greatest shortcoming of the data is the fact that, because of confidentiality clauses, data are not published in some of the sub-branches where the big Latvian manufacturing enterprises are operating (on the level of 4 digits by NACE 2.0 classification – data is available on a 2 digit aggregation). Looking at the actual data, it is easy to see that the published data are missing such Latvian manufacturing giants as "Liepājas metalurgs", "Olainfarm", "Grindeks", "Rīgas kuģubūvētava", "Valmieras stikla šķiedra" and others. The data are also rather delayed: currently, the data for 2012 are available, but the data for 2013 will come available only in mid-2015. Data with a high degree of detailed elaboration have been available only since 2008, which means that there are only five observations, obviously too few for an econometric analysis of time series (suitable perhaps only for conducting panel regressions). It
Thus there are many advantages, but the number of shortcomings is also rather substantial. A logical question arises: of what use are such data?
1) For advancing hypotheses and checking initial correlations. In the case of microdata, even a single serious simulation of data and examination of hypothesis can take up many computer hours. In the case of SBS data, a hypothesis can be examined relatively quickly, because the data are available already structured in Eurostat databases. If necessary, this hypothesis can be further examined with the help of microdata;
2) Data can be compared to other EU countries. In the case of microdata, it is rather cumbersome to obtain data from other countries.
Added value in manufacturing
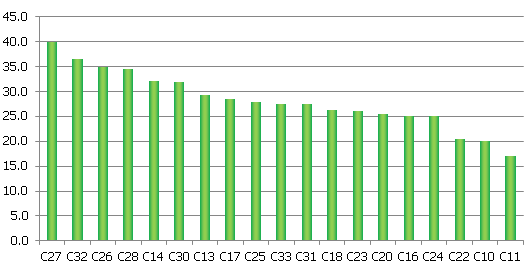
Owing to SBS data, it is possible to see in which branches of manufacturing in Latvia the ratio of added value to turnover is the highest. The results are not particularly surprising: branches with a high added value are the production of electrical equipment (C27), other kinds of production (C32), production of computers, electronic and optical equipment (C26), production of mechanisms (C28) and other transport vehicles (C30). I am surprised that the production of wearing apparel (C14) is found among branches with a high added value proportion (in Fig. 6 below please see a more detailed breakdown of added value, which indicates a very high proportion of labour costs in the branch). At the other end of the spectrum is the production of beverages (C11), food (C10), rubber and plastic products (C22), metals (C24), and construction materials (C23), as well as the largest branch of manufacturing, wood industry (C16).
Fig.3. Ratio of added value of manufacturing sub-branches to turnover, 2012, %
Data source: Eurostat
It is also interesting to see Latvia's place, as regards this indicator, against the background of EU countries. Latvia is above the EU average, in the same group as Estonia, Italy, Germany, and Sweden. The absolute leaders in this group are Ireland, Denmark, and the United Kingdom, with Luxembourg, Slovakia, and Lithuania at the other end of the spectrum. What does it mean? It means that on average, Latvian manufacturing can add to intermediate consumption more (in relative terms) added value than many other EU countries. That in turn means that there is more to be distributed among the participants in the economy -- entrepreneurs (profits), households (compensation), and the state (taxes). Why is it so? What is added value, in simple terms? It is the value that an entrepreneur can add to intermediate consumption, (e.g., to raw materials). The added value is work (e.g., in wood processing, a product is manufactured from a block of wood) and it is the mark-up that the entrepreneur is after to finance the future operations of his business and, of course, to satisfy his wish for profits. Knowledge and technologies are also "hiding" under the mark-up. If there is some technology or skills at the disposal of an enterprise that are lacking for its competition, then the enterprise can offer its end product at a higher price, i.e. with a higher added value. Therefore it is not surprising that, in the case of Latvia, there is a higher added value in branches where knowledge, patents, inventions, expenditure for research and development are of great importance. Thus, in a way, the indicator points to the competitiveness of the product manufactured by a particular sector. From this point of view, we have reason to celebrate, because, compared to other EU countries, Latvia can still manage to add relatively much added value. Another explanation for the higher proportion of added value in Latvian manufacturing is its lesser involvement in global value chains – i.e., a larger part of the production is manufactured locally, and there are fewer instances where only a small part of the many tasks of the large chain is carried out.
Energy component in the operations of enterprises
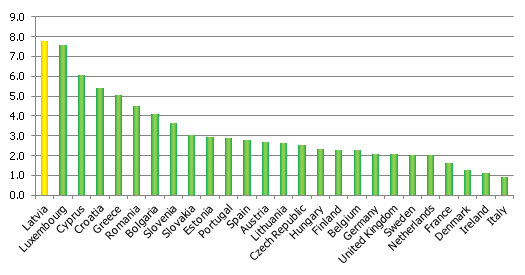
For quite some time now, one of the issues of the greatest interest to me has been the very significant problems created for Latvian businesses by the relatively high energy prices in Latvia. In recent years, as the discussion heats up about the future prospects and options of the Latvian energy sector, entrepreneurs have been raising their voices about the fact that energy costs put Latvian businesses at a disadvantage not only vis-à-vis third countries, but also vis-à-vis external trade partners within the EU. The management of energy intensive enterprises indicates that the existing energy tariffs (particularly electricity) are lowering their competitiveness. Likewise, the existing tariffs are not promoting any new energy intensive industry from being developed in Latvia. Yet the power industry is a complicated sphere, therefore direct comparisons do not amount to much: a simple comparing of tariffs usually ignores several support mechanisms that are available in many countries. This is why SBS provides a rather interesting insight into this sphere. There is an item in the SBS data, which describes purchasing of power products, i.e. expenditure for power in monetary terms. That makes it clear which branches of manufacturing in Latvia are energy intensive and also where Latvian manufacturing is found on the EU map in terms of energy intensity. In Latvia, the most energy intensive branches are other production (C32), wood industry (C16), chemical industry (C20), and the production of construction materials (C23). Meanwhile, the manufacturing of computers, electronic and optical equipment (C26) and mechanisms (C28) are the least energy intensive.
Figure 4. Expenditure for power against turnover, %, 2012
Data source: Eurostat
In Figure 5, I have related the purchase value of energy products against turnover among the EU countries. From this indicator thus can be seen how energy-cost intensive is the manufacturing branch of a particular country. It is obvious that in Latvia this indicator is the highest, which helps to explain the worry expressed by many entrepreneurs that the energy sector is putting an increasing pressure on the competitiveness of manufacturing. Evaluating these data, the so-called composition effects must be kept in mind: i.e. the Latvian manufacturing has a greater share of energy-intensive sub-branches. That means that we can not quite judge the efficiency of energy use. If, according to some agreed assumptions, the structure of manufacturing of all countries were normalized (all countries getting an equal weight of sub-branches), then Latvian manufacturing would probably no longer be at the very top. If we look at energy tariffs (electricity, natural gas), then Latvia is not at all among the countries where the tariffs for the industrial consumers are the highest. According to Eurostat data, the price of electricity for the large consumers in Latvia was the 8th highest among the EU countries (26 countries, second half of 2013, including distribution and transmission tariff and taxes) and that of natural gas was the 9th lowest (21 countries, consumption group from 1 to 4 GJ, first half of 2014, including taxes). The fact that Latvian manufacturing enterprises are so dependent on energy expenditures but energy carrier tariffs are not the highest point to two factors:
- The structure of Latvian manufacturing is such that energy intensive sub-branches of manufacturing predominate. Compared to the EU average structure, there is a large proportion of wood processing, metal processing and construction material production and all of these branches are energy intensive. In part, that creates the effect of Latvian manufacturing to be so dependent on energy expenditure.
- Latvian manufacturing enterprises are still very inefficient from the point of view of energy efficiency. Unfortunately, there are no ways of really comparing energy efficiency in industry by country, but the energy experts surveyed are almost in full agreement that there is much room for improvement in the Latvian industrial sector. Unfortunately, not even the first step has been made: there has been no all-inclusive energy audit programme that would allow for any conclusions as to how big the problems are. Up to now, only some enterprises have conducted serious energy audits and have dealt with the problems that were uncovered.
What follows from the fact that Latvian manufacturing is so energy intensive? What follows is that economic policy makers must urgently address energy issues in manufacturing. The priority of energy policy is to ensure reliable and competitive (in terms of price) energy: right now, a number of projects are underway that will increase the security of energy supply in Latvia and the Baltic countries, promote diversification and possibly make for more attractive tariffs. Yet up until then, support for the energy intensive manufacturing also should be considered. Right now, the Ministry of Economics has turned to straightening out the issue of mandatory purchase component (MPC), i.e. principles for granting reduced costs for energy intensive enterprises are being reviewed. True, for the time being, there are more questions than answers. What would be the definition for an energy intensive enterprise? If "what percentage expenditure for energy accounts for in the total structure of expenditure", then I am sure that many enterprises will separate their production units into individual SIA to get the status of an energy intensive enterprise. There is also the question from where the financing for covering the discounts would come: would that mean a greater burden for the rest of the industrial enterprises, increased tariffs for households or simply lesser profits for "Latvenergo"? Likewise, the question remains whether the European Commission (EC) would support such selective support for enterprises: previously, the EC has been very scrupulous (and slow) in considering such instruments. That means that this scheme will not be introduced any time soon.
Costs of labour and the profits of branch enterprises
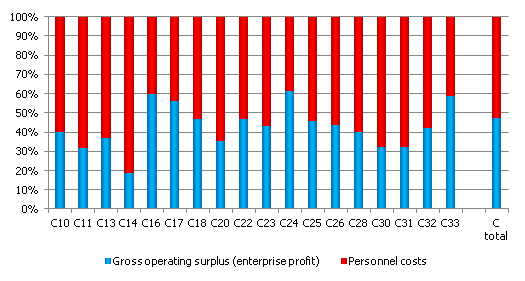
The SBS data provide the interesting opportunity to look at the added value of manufacturing sub-branches in a slightly finer breakdown than usual. The added value is possible to express as a sum of the employee compensation fund and enterprise gross operating surplus (or profits). Thus it is possible to see how much of the added value an enterprise has left for itself and how much has been paid to employees. Figure 6 shows that the distribution is about equal: one half of the added value is provided to employees and the other half remains with the enterprise. Yet the situation tends to be substantially different in a breakdown by sub-branch. Thus, for instance, it is plain to see what the enterprises producing wearing apparel (C14) post and what the Association of Light Industry Enterprises does: entrepreneurs cannot increase compensation because the gross operating surplus by enterprises is very low and, given the existing productivity indicators of enterprises, further growth is limited. This is borne out by recent data: the output of wearing apparel enterprises has been on a stable downward trend.
Figure 5. Ratio between gross operating surplus by Latvian manufacturing sub-branches and personnel costs, 2012, %
Data source: Eurostat
Meanwhile, in wood industry (C16), metal production (C24), and repair and installation of equipment and appliances (C33) gross operating surplus substantially exceeds personnel costs, which means that most of the added value remains at the disposal of the enterprise, and that in turn means that the branches at hand are more capital intensive instead of workforce intensive. Yet we should hasten to note that the added value does not always correspond to cash flow, i.e. it cannot be said with absolute certainty that the sub-branch, which has a high proportion of gross operating surplus slights its employees, for taxes must be paid and new investment projects financed from the gross fetch part.
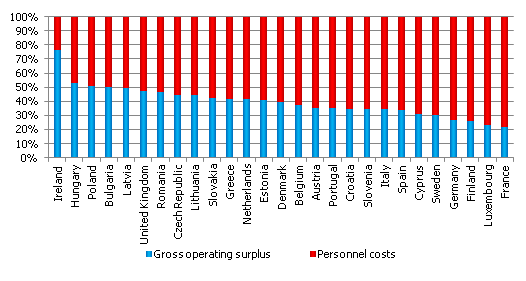
Fig. 6. Ratio between gross operating surplus and personnel costs in manufacturing in EU member states, 2012, %
Data source: Eurostat
It is even more interesting to look at these data in a breakdown by EU country. Arranging the countries by the proportion or personnel costs in the added value we see what we can surmise without evaluating the data. Latvia is at the part of the spectrum where the gross operating surplus forms a relatively great part of the added value. At the other end of the spectrum, as could have been expected, are the countries with very powerful trade unions – France, Finland, Germany, and Sweden. Why is this picture important? Because, in a sense, it demonstrates the potential of the prices of manufacturing production of the relevant countries, which I discussed in my article about the middle income trap and Latvia's chances of avoiding it. Namely, the manufacturing enterprises of the countries where the proportion of gross operating surplus is still high, in all likelihood still have an opportunity to raise the compensation of their employees on the basis of inner resources, i.e. without raising the cost price of the production manufactured but by the entrepreneur declining his part in the added value (profits). For the enterprises of those countries whose gross operating surplus proportion is small, nothing remains to do except finance the rise in compensation from the rise in the price of the production. That of course has a negative impact on the price competitiveness.
Productivity
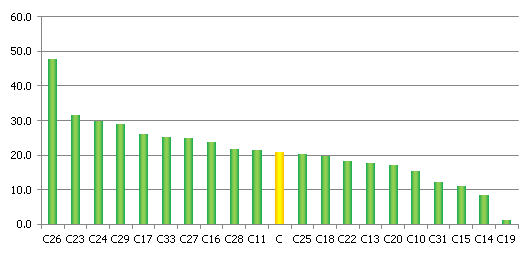
Now that the growth rate of Latvian economy is slowing down and manufacturing is posting meagre results, analytical minds tend to turn to issues related to productivity and its determining factors (both the productivity of workforce and total factor productivity). Under the conditions where the investment activity is low and the unfavourable demographic situation no longer promotes economic growth, a stable increase in productivity plays an increasingly large role in economic growth. Productivity plays the decisive role in manufacturing – both from the microeconomic point of view (productivity is one of the main factors that will determine the earning potential) and from the macroeconomic side (productivity will determine economic growth). Whether or not the Latvian manufacturing can ensure rising productivity will determine whether the Latvian economy can avoid getting trapped in the so-called middle income trap (I discussed this phenomenon in the aforementioned article). In this context, one of the main questions is whether the compensation differentials with the EU countries (convergence target) still ensure convergence possibilities for Latvia. In other words, if the low price of Latvian workforce is still low enough (also considering productivity) for the production manufactured in Latvia to be competitive from the point of view of price. One of the aims of using SBS data is the opportunity to look at various productivity indicators by sub-branch/country. Figure 8 shows the added value of Latvian manufacturing per employee per sub-branch. which is the most popular way of looking at productivity. At the high end, there are no surprises: the production of computers, electronic and optical equipment (C26), non-metallic minerals (C23), metals (without taking into account "Liepājas metalurgs", however), automobiles, trailers, and semi-trailers (C29). At the low end, if the production of coke and oil products is excluded, where there are very low output volumes, we see the entire range of light industry – production of textiles (C13), wearing apparel (C14), and leather products (C15), as well as the food industry (C10), and furniture production (C31).
Fig. 7. Added value per employee (full-time equivalent), thousands of euro, 2012
Data source: Eurostat
Overall, the result obtained reflects the commonly held view that the light and food industries are branches with a low added value per employee, whereas the production of different transport vehicles, mechanisms, and electronic equipment production has a high added value. It should be kept in mid, however, that in this case, the added value has been expressed per one employee, which means that the efficiency of all other production factors is not being taken into account. For instance, the high added value per employee in wood industry (C16) is somewhat surprising. This branch in various international comparisons tends to be mentioned as not productive. In the case of Latvia, this branch is more productive than manufacturing overall. That is likely to be explained by the relatively high mechanization level in the branch. Namely, in the post-crisis years, there have been sizeable investments for the purpose of modernizing equipment and automation of technological processes.
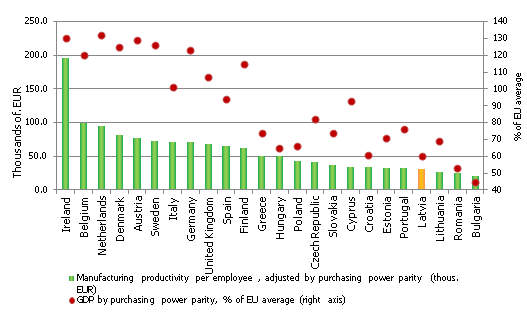
It would be interesting to look at productivity indicators comparing different countries, yet, because the SBS data are available only nominally, such a comparison would not lead to anything. Expressing the added value per employee or per hour worked would only indicate the substantial differences between price levels in different member states and, as a result, no reasonable comparison could be made. Therefore, to liquidate the price effect at least in part, I adjusted the added value using the purchasing parity ratio, which, albeit not a very precise approach (the purchasing parity ratio refers to the economy at large instead of a particular branch), nevertheless allows the comparison between the productivity levels among different countries. The picture obtained holds no surprises: Ireland, Belgium, the Netherlands, Denmark, Austria, Sweden etc. are at the high end, whereas the low end is mostly filled by the "new" EU member states, including Latvia. Interestingly enough, Portugal and Greece are also at the low end – and both of them have faced substantial problems within the euro area debt crisis
Fig 8. Productivity level per one employee (full-time equivalent, adjusted by purchasing power parity), GDP adjusted by purchasing power parity 2012
Data source: Eurostat
As can be seen in Figure 9, the correlation between the productivity of manufacturing and the GDP indicator of the economy is fundamentally stronger than the one seen in Figure 2. Thus, when setting the aims of economic policies, it is not the share of manufacturing in the total added value that should be discussed but the objectives of increased productivity. It follows from the figure that the productivity of Latvian manufacturing is about twice as low as the level in Finland and almost three times lower than that in the leading EU countries. On the one hand, it is extremely bad news, which means that a number of factors determining productivity are still at a very low level in Latvia. On the other hand, it implies a potential and room for further convergence. In my opinion, it is a rise in productivity that should be the main priority in the vision of economic policy makers. What then should be done to raise productivity and what is it that determines productivity increase? The factors determining the productivity of workforce can generally be divided into four groups:
- Capital factor i.e., how much capital is available per employee or what is the amount of additional resources available per employee that would make work simpler, quicker, more productive. It could be the amount and quality of equipment that mechanizes work or various other production factors –production premises, transport, etc. In the case of Latvia, in recent years there has been much talk about weak lending and investment dynamic. Yet it is in manufacturing where the investment dynamic is not so bad. According to the Eurostat data (for 2012), this is borne out by the indicator measuring the amount of investment in manufacturing against the added value. In Latvia it is among the highest in the EU, as are those of Romania, Bulgaria, Estonia, the Czech Republic, Croatia, and Slovakia – the countries of the "convergence group". Of course, it would be best to consider the amount of accumulated capital in manufacturing but unfortunately no data that could be used in international comparisons are available. In all likelihood, such data would indicate that the amount of accumulated capital in Latvian manufacturing is low compared to other EU countries, which is one of the factors that determines the relatively low productivity of workforce. Long-term economic policies are thus necessary (for increasing the amount of accumulated capital is not an issue that can be resolved in one day), aimed at maintaining/promoting investment activity in manufacturing. In Latvia, there are a number of instruments that are functioning already (EU funds, various corporate income tax allowances etc), yet it seems that the efficiency and targeting of instruments so far have not been quite adequate.
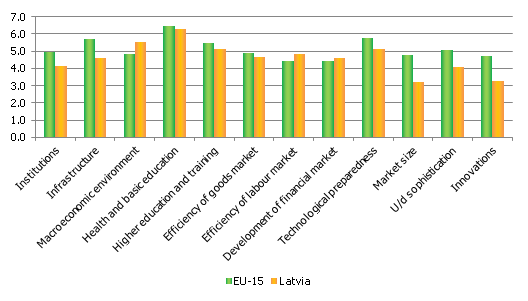
- Workforce related factors. These are factors affecting the "quality of workforce" – education, skills, abilities, knowledge and – very important – health. Publicly, there has been much talk about the necessity for reforms in the areas of education and healthcare. It is the quality of these two sectors that mostly determines the quality of the so-called human capital, which in turn fosters productivity. It is no secret that in the sectors of healthcare and education (particularly higher and professional) there are still a number of problems. As the global competitiveness index and its sub-indicators (Fig. 10) reveal, Latvia has the second worst health situation sub-indicator among the EU countries, leaving only Romania behind. All indicators of course have their own methodological peculiarities and nuances, yet I do not think that anyone would try to claim that everything is fine with the Latvian healthcare system. The higher education and training indicators likewise lag behind the average level of EU-15.
- Factors determining the productivity of the production process. These include the organization of work at the enterprise, the optimization of processes, the ability to combine technologies, knowledge, and skills. Efficiency of the production process is the factor that is the broadest and hardest to define. It includes the size of the market for the production of the particular enterprise/branch, level of innovation, accessibility of the technological processes and latest equipment, as well as entrepreneurship ability and process management. Assessed from the perspective of the index of global competitiveness, it is in these indicators that the Latvian economy is most outpaced by the benchmark group, the EU-15 countries. The size of the market in Latvia is what it is. A gradual and ever deeper integration of the Latvian economy with the European economy and global supply chains is gradually widening the possibilities for Latvian entrepreneurs. The situation with innovations, however, is dismal, to put it mildly; and this problem was addressed by my colleague Agnese Rutkovska in an excellent article.
Institutional factors. These include tax legislation, legal basis, public physical infrastructure, etc. The assessment of institutional factors and public infrastructure in the case of global competitiveness index lag behind the EU-15 average to a substantial degree. That includes a very wide area – public infrastructure (mostly transport – roads, railroads, flight connections, energy, and communications), law (particularly property law), efficiency of civil servants, transparency and predictability of economic policies, business ethics etc.
Fig. 9. Evaluation of 12 sub-indexes of global competitiveness index in Latvia and EU-15 group
Data source: World Economic Forum
What should be done?
What should be done for the Latvian manufacturing to become the engine of the Latvian economy?
- Return to implementing industrial policies. A few years ago, economic policy makers were actively at work, developing and implementing industrial policies, but right now it seems that these activities are languishing. It is understandable that right now, in 2015, there is a number of topical issues that have to be addressed and require vast resources – education, healthcare, and defense. Yet to ignore the development of industry means reducing the future potential. The goal should also be defined correctly: it should be not some particular level or proportion of output or added value, but a particular level of productivity, e.g., 50% of the EU average. It is the growth of productivity that determines the growth of the branch and the economy at large.
- The economic policy makers in recent years have mostly concentrated on increasing the availability of financing. The availability of financing is undoubtedly one of the cornerstones of the growth of the branch requiring extra attention. Yet the availability of financing does not have a direct effect on the main branch success factors, productivity and competitiveness. The first step would be to understand what determines growth in productivity and competitiveness of Latvian manufacturing enterprises (Latvijas Banka also does research on this topic; there have been several publications and "Conversations of Experts"). The next step would be to understand what the state can do to increase the productivity levels of entrepreneurs. Of course, most of the work is up to the entrepreneurs themselves, but the state, using "carrot and stick" policies can accelerate the process.
- Cutting or gradually lifting the tax on reinvested profits. This instrument has been discussed for a decade. There is no one who would seriously doubt that the introduction of this principle would leave a positive impact on industry (and other sectors), but the stumbling stone has always been the fiscal impact of this measure. Namely, the corporate income tax forms a relatively small, yet important part of the national budget. Consequently, the reduction of the tax on reinvested profits would have a negative fiscal effect – at least in the shorter term – which would have to be compensated by some mechanism, i.e. the introduction of such an instrument should be fiscally neutral.
- Any modern theoretical literature on industrial policies is likely to mention the involvement of local governments. Currently, a local government does not get much direct benefit from the development of entrepreneurial activity in its territory: only a part of the income from personal income tax is gained (and only if they have declared their residence at that location). I believe that the economic policy makers should think how they could stimulate local governments to compete among themselves in terms of attracting enterprises/businesses. That could be effected if at least a part of the corporate income tax ended up in the local government budget. It would be an additional motivation for local governments to consider their infrastructure and offer to industries. It might also stimulate the development of industrial parks within municipalities – in this area, we still lag much behind other EU countries. Such a solution should also be considered in the context of regional policies.
- The developing employment problems in the sector should be addressed. In several sub-branches of manufacturing, entrepreneurs face shortages of workforce. The two main reasons mentioned are not the differences between the wages required and offered, but knowledge and skills that do not answer the needs and the low mobility of workforce, i.e. an employee can be found but three municipalities away. Moreover, even if the existing enterprises are yet to discuss workforce problems, there is a whole range of foreign enterprises that have already chosen Bulgaria, Romania or Poland over Latvia, for here they have not been able to fill their vacancies. I see raising the prestige of professional education and ensuring practical training in enterprises as the main tasks to be addressed. There should be state programmes that would make it easier for young people, particularly senior year pupils and students to enter enterprises in order to acquire practical experience.
- However, even if the problems of workforce mobility and issues of knowledge/skills are addressed successfully, no leap in output volumes can be expected without radical steps. The demographic situation is what it is and there is no reason to expect any improvements in the near future. Thus at some point, the issue of relaxing immigration policies for workforce from third countries will become very topical. Immigration policies are a sensitive topic and in this case, there is a number of issues that should be considered in a timely manner and without giving in to emotion.
- Another reserve for the Latvian manufacturing potential is found in the energy sector. Work should be done in at least three directions.
- Optimization of infrastructure. There is not just great deconcentration of population but also of industrial enterprises. Outside the capital, they tend to be located far from each other. From the point of view of the energy industry, that creates additional problems. Each enterprise must get its own connection, which then has to be serviced. That tends to increase the distribution tariffs, which has an ill effect on these same enterprises. That's even more reason for local governments to consider developing special industrial territories with power connections already in place.
- One of the priority tasks is to deal with the burden placed by electrical power tariffs on the competitiveness of energy intensive manufacturing enterprises. Latvia has a number of very energy intensive enterprises in whose expenditure structure, energy accounts for 15-25% and sometimes even more. In many cases, enterprises are active in sectors where the profit margins are very small, measuring just a few percent and therefore the electrical power tariff is holds great significance for the existence of these enterprises. The Ministry of Economics is currently working on regulations that would allow the burden of the mandatory purchase component on these enterprises to be reduced. That is the first step in the right direction. Caution should be used, however, in granting selective support. Namely, the rules of the game should be clear and just, to have no confusion as to some enterprises can lay claim to support and others cannot.
- The issue of raising energy efficiency in manufacturing may be of even greater significance. Up to now, the energy audits conducted in manufacturing enterprises more often than not have found out that significant energy economy can be accomplished without any significant financial investment and only by optimizing the energy processes. The entrepreneur can invest what has been saved for the purpose of raising energy efficiency and thus competitiveness. Yet the main problem for now is the low level of information entrepreneurs have on the advantages of an energy audit. In my opinion, therefore, there should be an all-encompassing state support instrument that would promote energy audits in manufacturing enterprises (the exact mechanism is of course a matter of debate).
SBS data analysis is a process parallel to the work already being done by the economists of Latvijas Banka: it involves analyzing microdata, and its first results were already presented in the Conversations of Experts in December 2014. It is clear that the promotion of further development of manufacturing is an interesting topic right now and Latvijas Banka will continue to pay special attention to the analysis of the structural dynamic of the sector. Right now, work is continuing on analyzing the enterprise level microdata whose results we will be able to present in the second half of the year.
[1] Data in the Eurostat data base section "Industry, trade and services" –> "Structural business statistics"
Textual error
«… …»


